Quenching, Mergers, and Age Profiles for z = 2 Galaxies in IllustrisTNG

Published in The Astrophysical Journal Letters, Volume 916, Issue 2, id.L23, 7 pp., 2021

Abstract

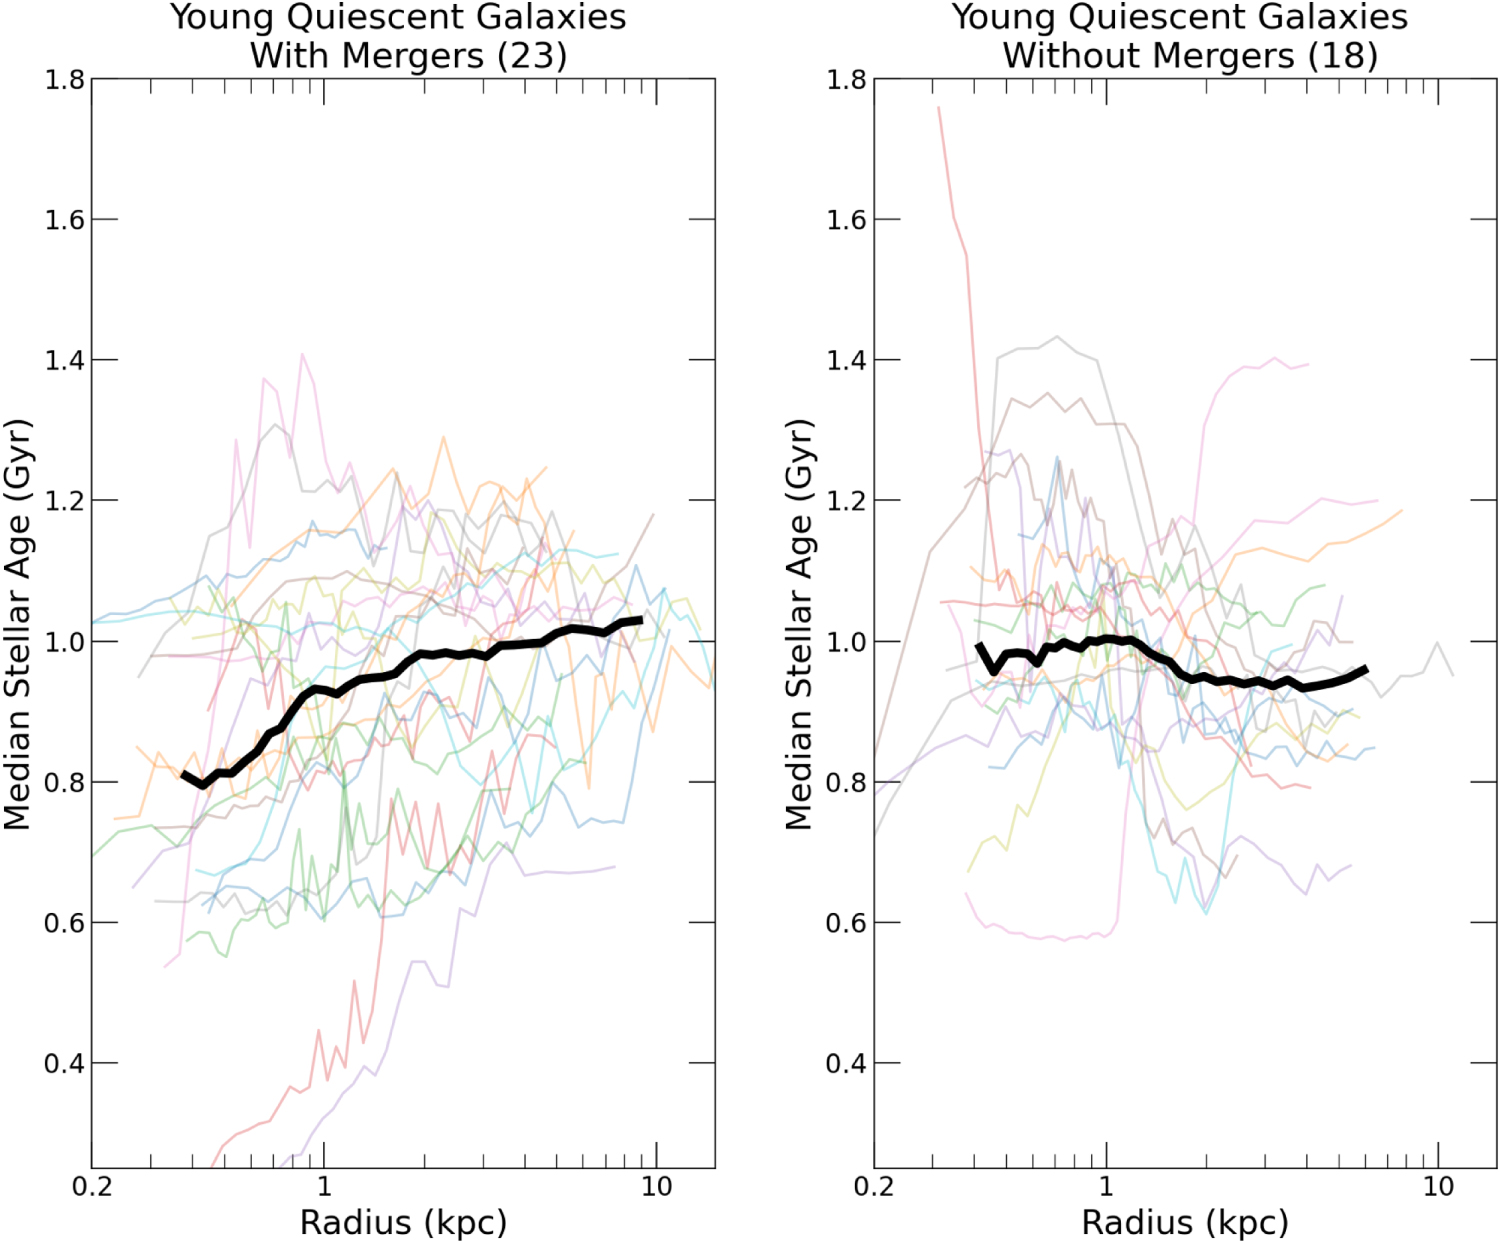
Using the IllustrisTNG cosmological galaxy formation simulations, we analyze the physical properties of young quiescent galaxies at z = 2 with stellar masses above 1010.5 M☉. This key population provides an unaltered probe into the evolution of galaxies from star-forming to quiescent, and has been recently targeted by several observational studies. Young quiescent galaxies in the simulations do not appear unusually compact, in tension with observations, but they show unique age profiles that are qualitatively consistent with the observed color gradients. In particular, more than half of the simulated young quiescent galaxies show positive age gradients due to recent intense central starbursts, which are triggered by significant mergers. Yet, there is a sizable population of recently quenched galaxies without significant mergers and with flat age profiles. Our results suggest that mergers play a fundamental role in structural transformation, but are not the only available pathway to quench a z = 2 galaxy.

Figures
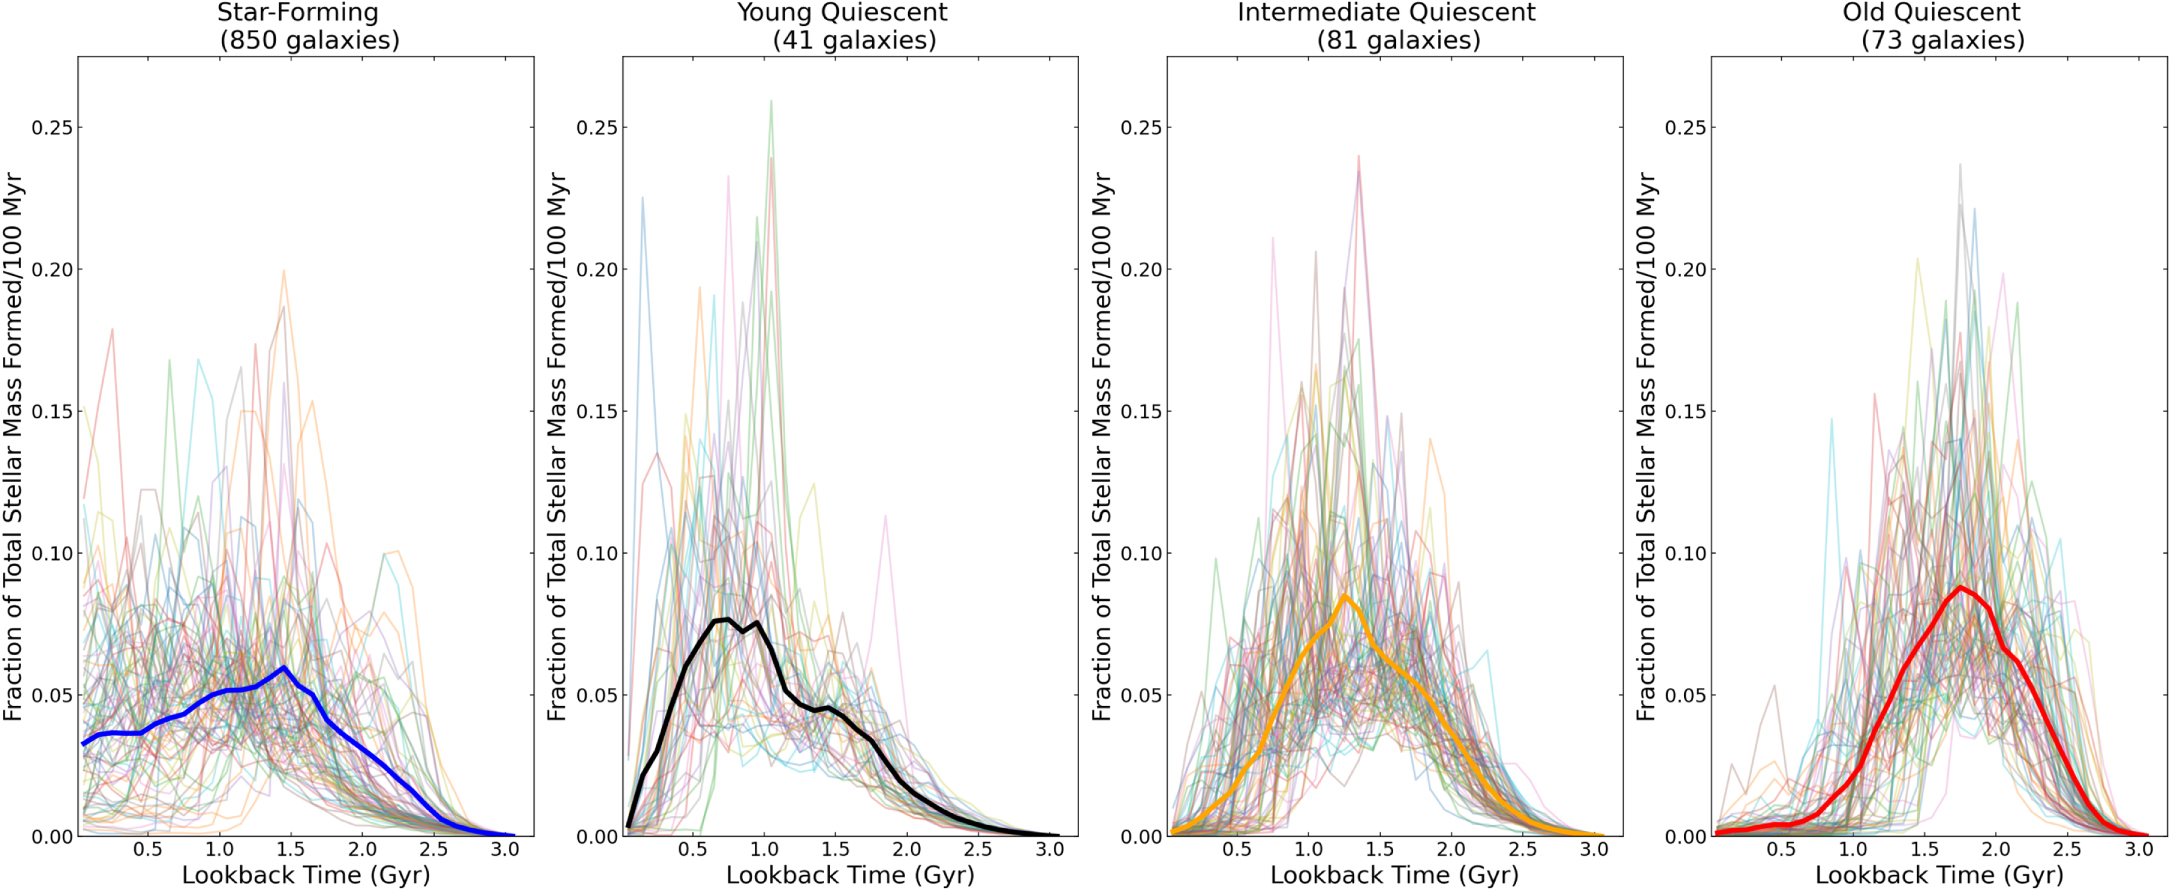
Figure 1. Star formation histories for the four galaxy populations. For the star-forming population we only show 80 randomly drawn galaxies, for clarity. The curves are binned over 100 Myr and normalized by the total mass formed by z = 2. In each panel, a thick line marks the median trend. The data and software to generate this Figure are available on Zenodo:10.5281/zenodo.5093727 (GitHub: https://github.com/pathakde/Pathak_2021).
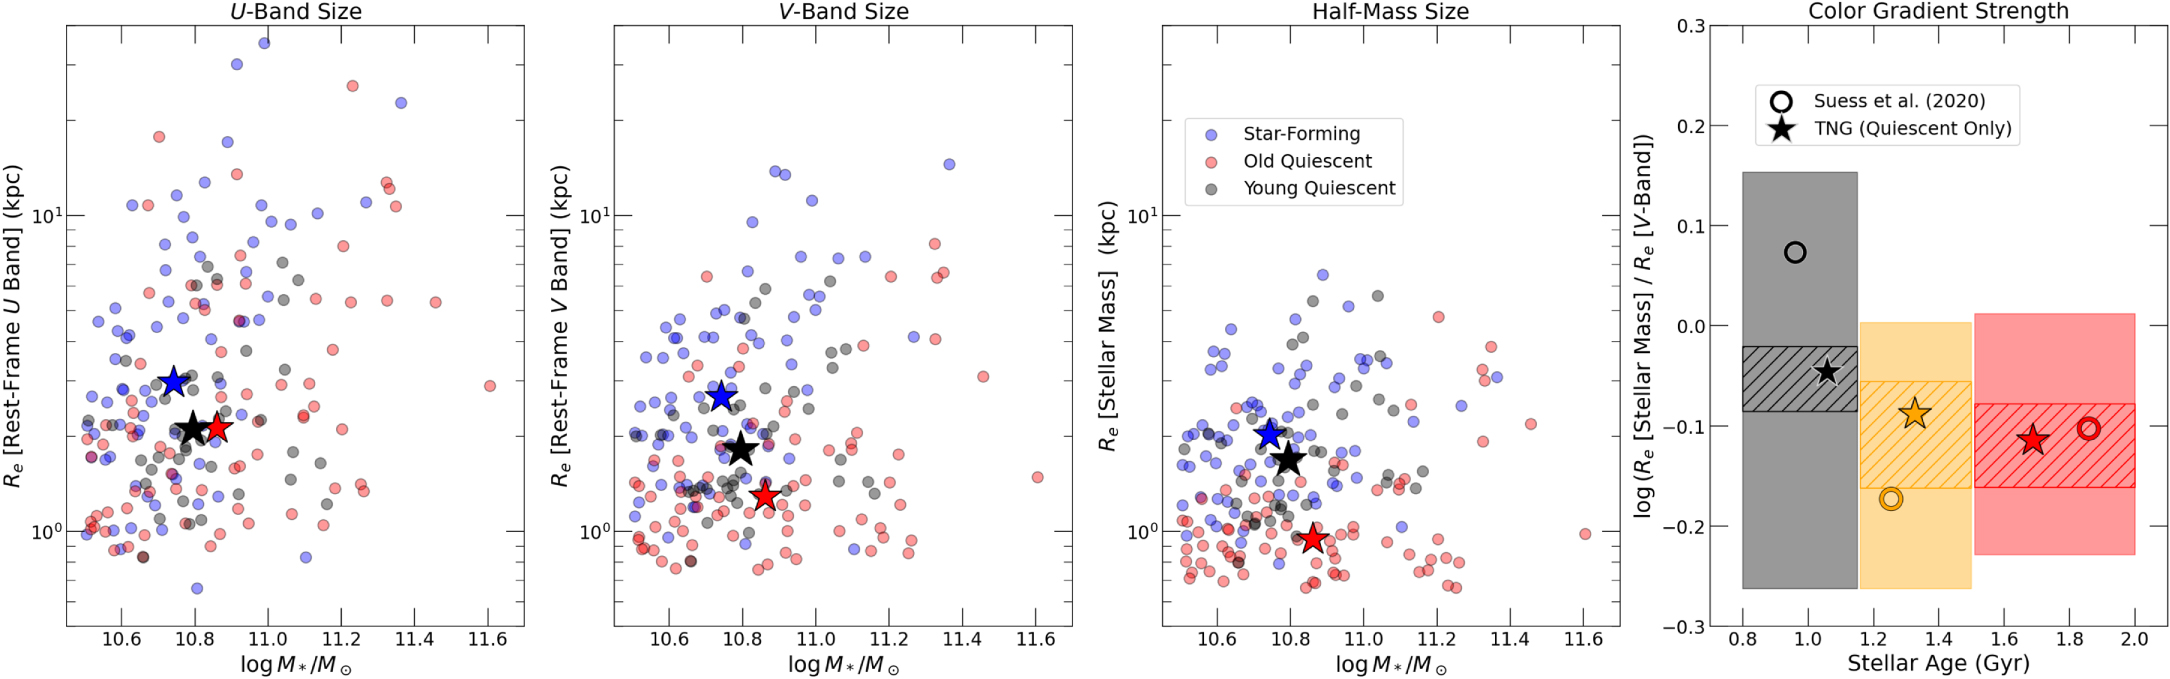
Figure 2. The first three panels show the effective sizes calculated in the rest-frame U-band, rest-frame V-band, and using the stellar mass distribution, as a function of total stellar mass. Galaxies are color-coded according to the populations defined in Section 2.2. For the star-forming population we only show 80 randomly drawn galaxies; we also omit the intermediate quiescent population from the first three panels for clarity. Stars mark the median values for each population. The last panel shows the ratio of half-mass and half-light (in the rest-frame V-band) size as a function of stellar age, for the three subsamples of quiescent galaxies. Star symbols mark the medians for the TNG galaxies, and empty circles mark the medians for the Suess et al. (2020) observed sample at 1.5 < z < 2.5. The 30th–70th percentile regions for both the simulation (hatched) and observations (shaded) are shown. The data and software to generate this Figure are available on Zenodo:10.5281/zenodo.5093727 (GitHub: https://github.com/pathakde/Pathak_2021).
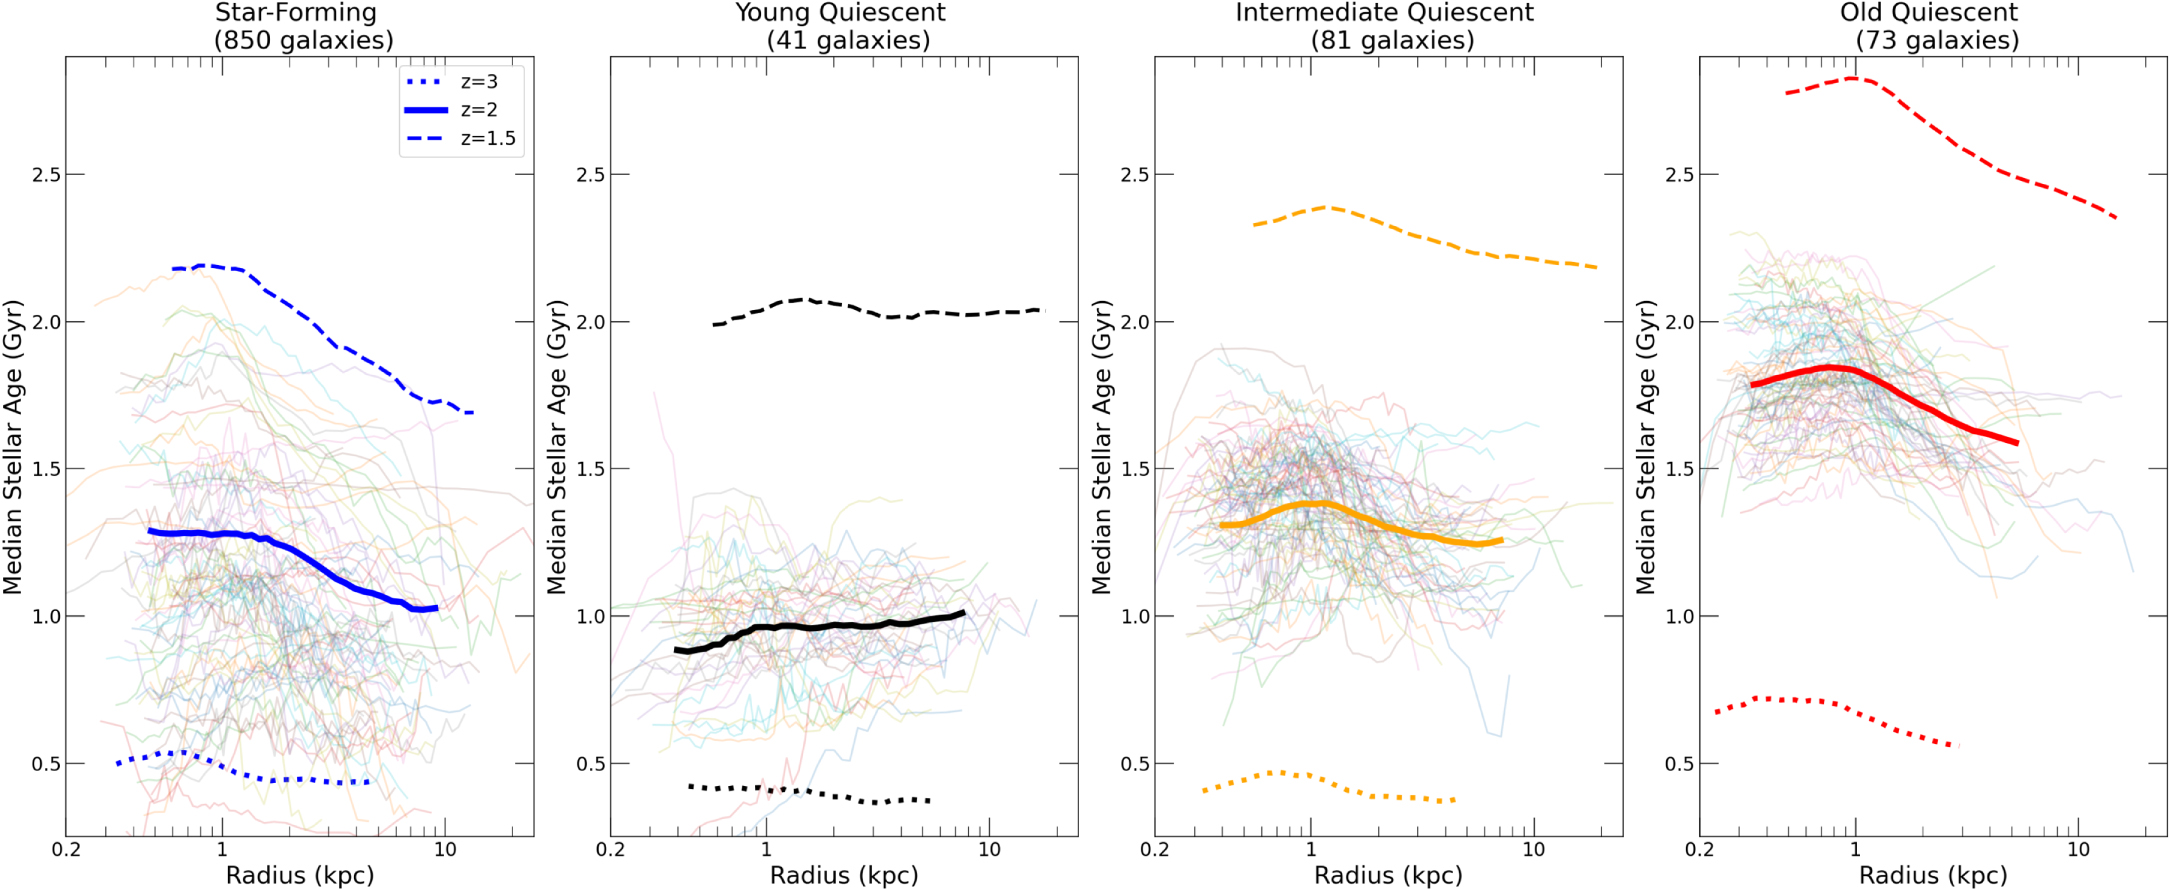
Figure 3. Radial age profiles for the four galaxy populations (thin lines). For the star-forming population we only show 80 randomly drawn galaxies, for clarity. The median for each population is shown in thick unbroken lines. The median for the main progenitors at z = 3 (thick dotted line) and the descendants at z = 1.5 (thick dashed line) are also shown. The data and software to generate this Figure are available on Zenodo:10.5281/zenodo.5093727 (GitHub: https://github.com/pathakde/Pathak_2021).
Figure 4. Age profiles of young quiescent galaxies, with separate panels for galaxies with at least one significant merger that contributes at least 10% of the z = 2 stellar mass (“with merger”: left panel) and those without such a merger (right panel). The data and software to generate this Figure are available on Zenodo:10.5281/zenodo.5093727 (GitHub: https://github.com/pathakde/Pathak_2021).
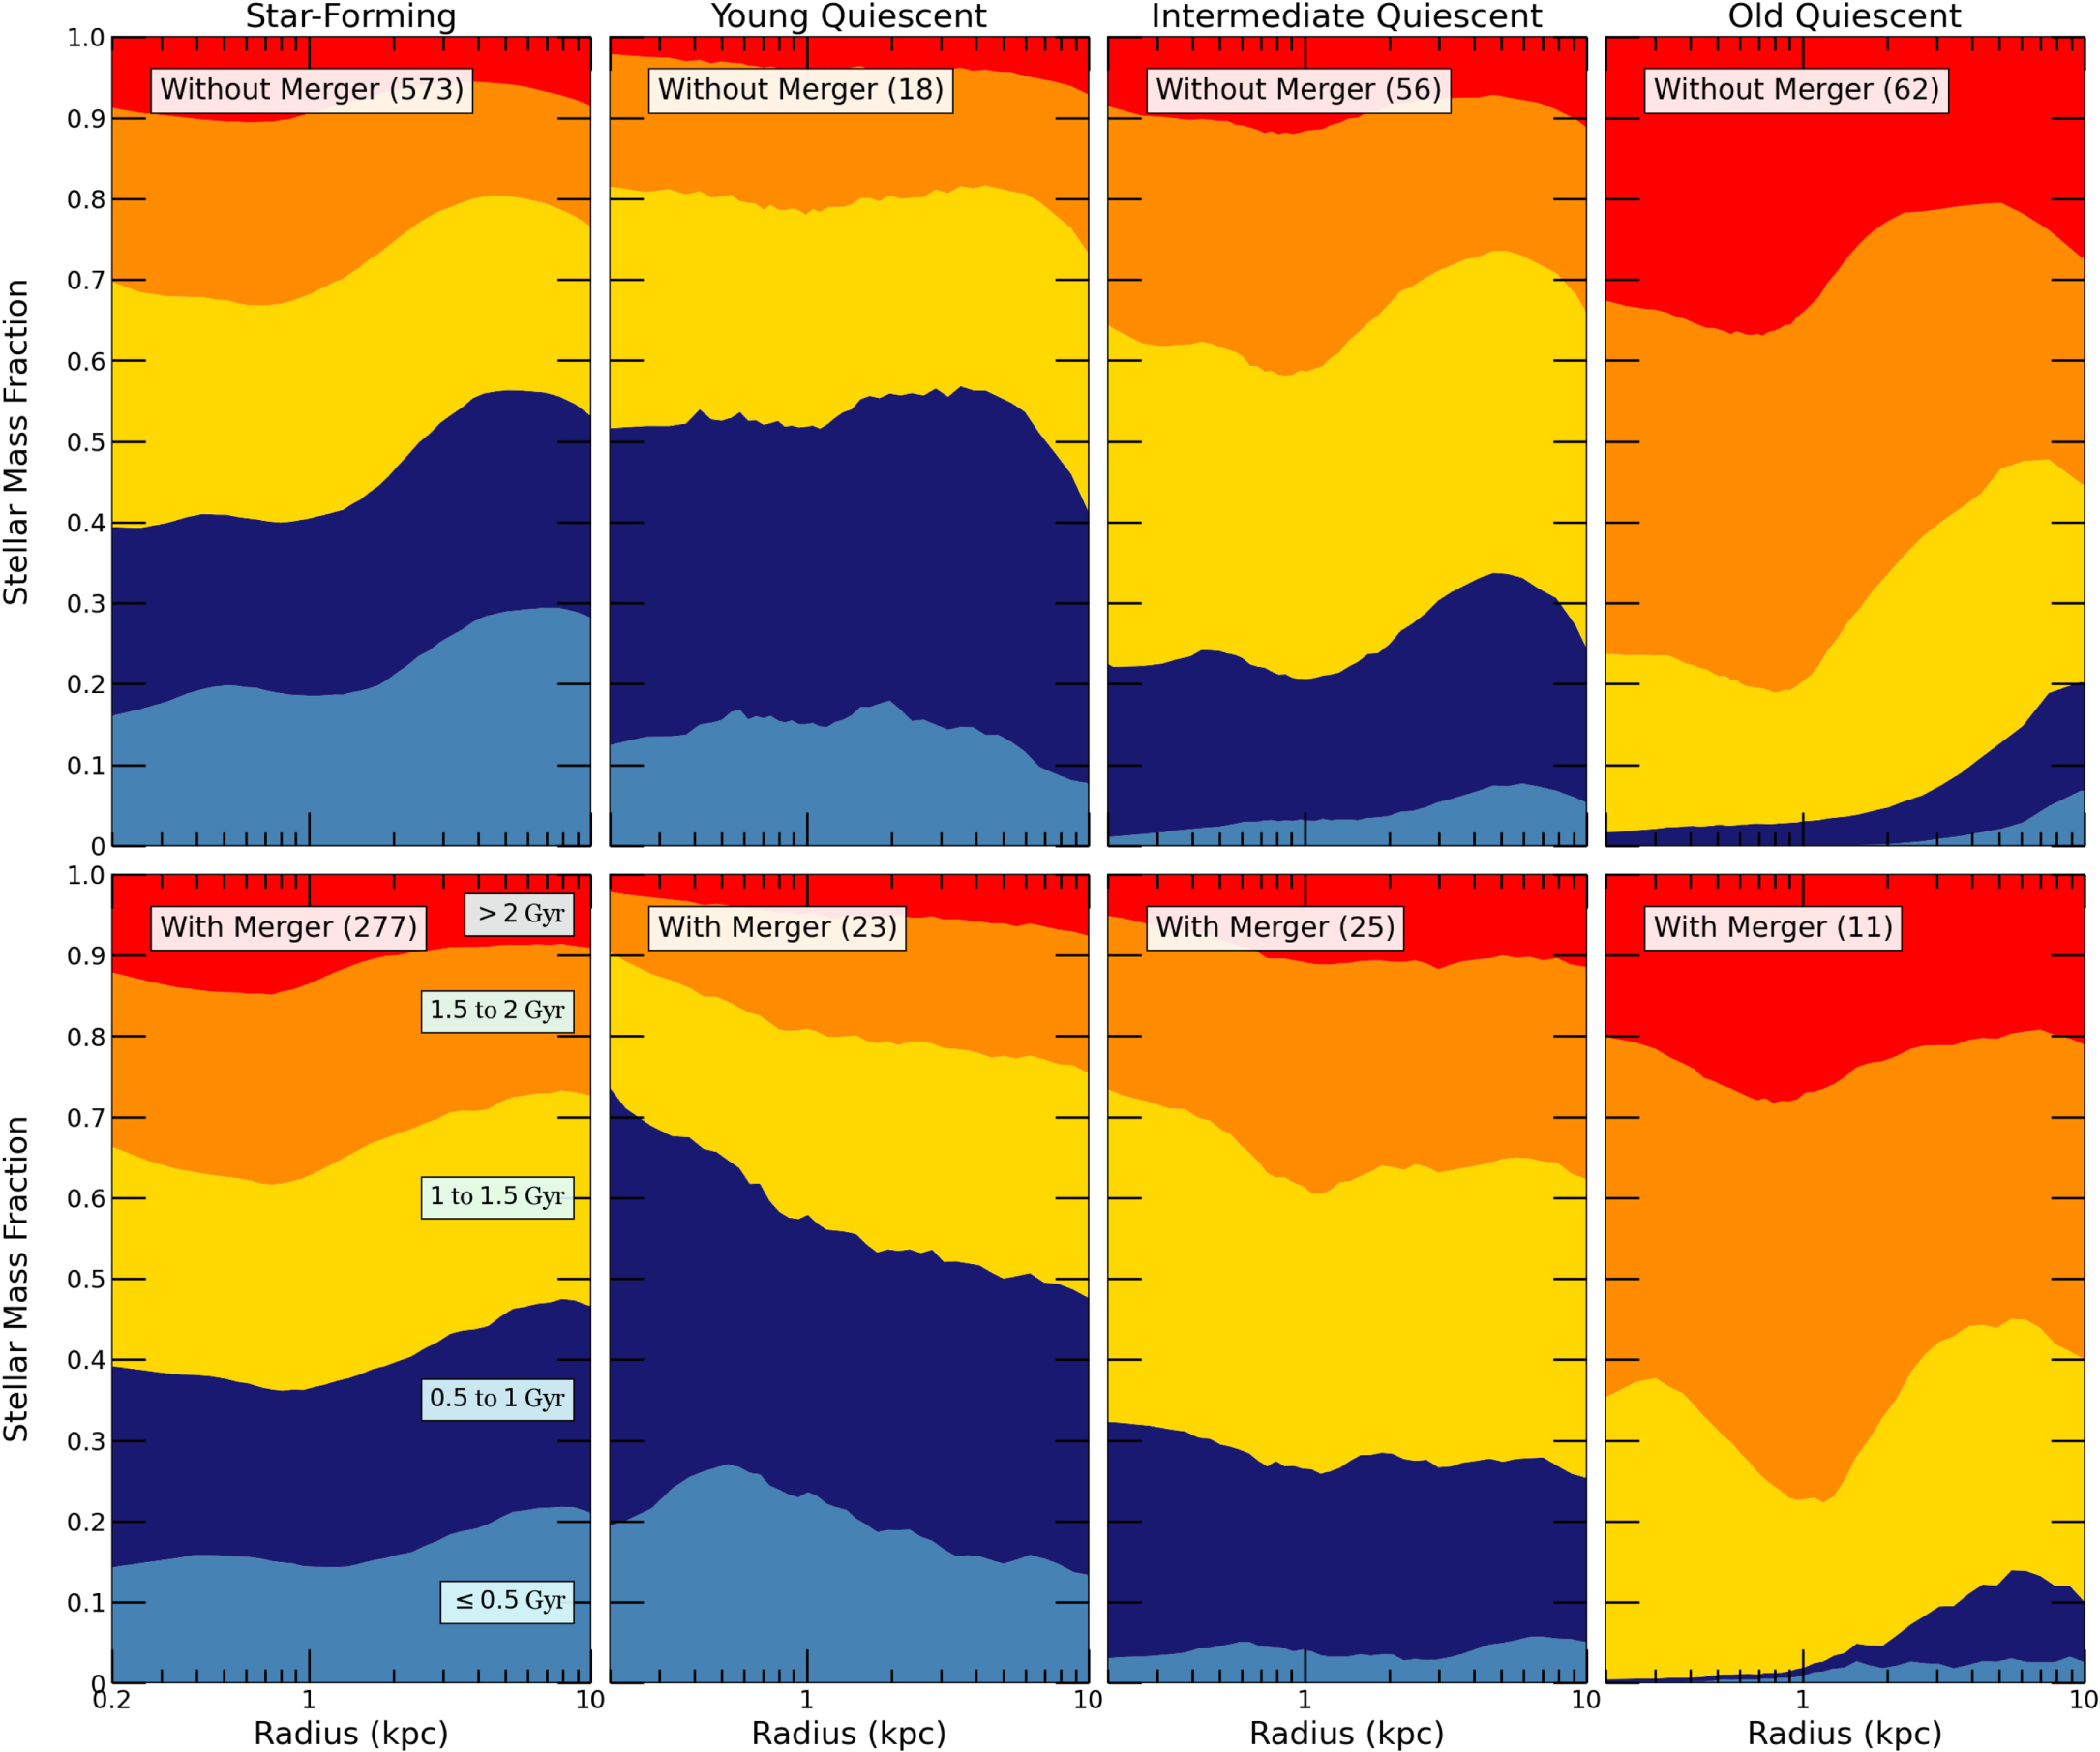
Figure 5. Stacked normalized histograms showing the radial distribution of stellar ages in each galaxy population. All stellar particles of all galaxies in a given population are split into five age bins; the colored bands show the fractional contribution of each bin to the total stellar mass, as a function of radius. Galaxies are divided according to whether they experienced (bottom row) or did not experience (top row) a significant merger prior to z = 2. The number of galaxies in each category are indicated in brackets. The data and software to generate this Figure are available on Zenodo: 10.5281/zenodo.5093727 (GitHub: https://github.com/pathakde/Pathak_2021).