A Two-Component Probability Distribution Function Describes the Mid-IR Emission from the Disks of Star-forming Galaxies

Published in The Astronomical Journal, Volume 167, Issue 1, id.39, 31 pp., 2024

Abstract

High-resolution JWST-MIRI images of nearby spiral galaxies reveal emission with complex substructures that trace dust heated both by massive young stars and the diffuse interstellar radiation field. We present high angular (0.″85) and physical resolution (20-80 pc) measurements of the probability distribution function (PDF) of mid-infrared (mid-IR) emission (7.7-21 μm) from 19 nearby star-forming galaxies from the PHANGS-JWST Cycle 1 Treasury. The PDFs of mid-IR emission from the disks of all 19 galaxies consistently show two distinct components: an approximately lognormal distribution at lower intensities and a high-intensity power law component. These two components only emerge once individual star-forming regions are resolved. Comparing with locations of H II regions identified from Very Large Telescope/MUSE Hα mapping, we infer that the power-law component arises from star-forming regions and thus primarily traces dust heated by young stars. In the continuum-dominated 21 μm band, the power law is more prominent and contains roughly half of the total flux. At 7.7-11.3 μm, the power law is suppressed by the destruction of small grains (including PAHs) close to H II regions, while the lognormal component tracing the dust column in diffuse regions appears more prominent. The width and shape of the lognormal diffuse emission PDFs in galactic disks remain consistent across our sample, implying a lognormal gas column density N(H) ≈ 1021 cm-2 shaped by supersonic turbulence with typical (isothermal) turbulent Mach numbers ≈5-15. Finally, we describe how the PDFs of galactic disks are assembled from dusty H II regions and diffuse gas and discuss how the measured PDF parameters correlate with global properties such as star formation rate and gas surface density.

Figures
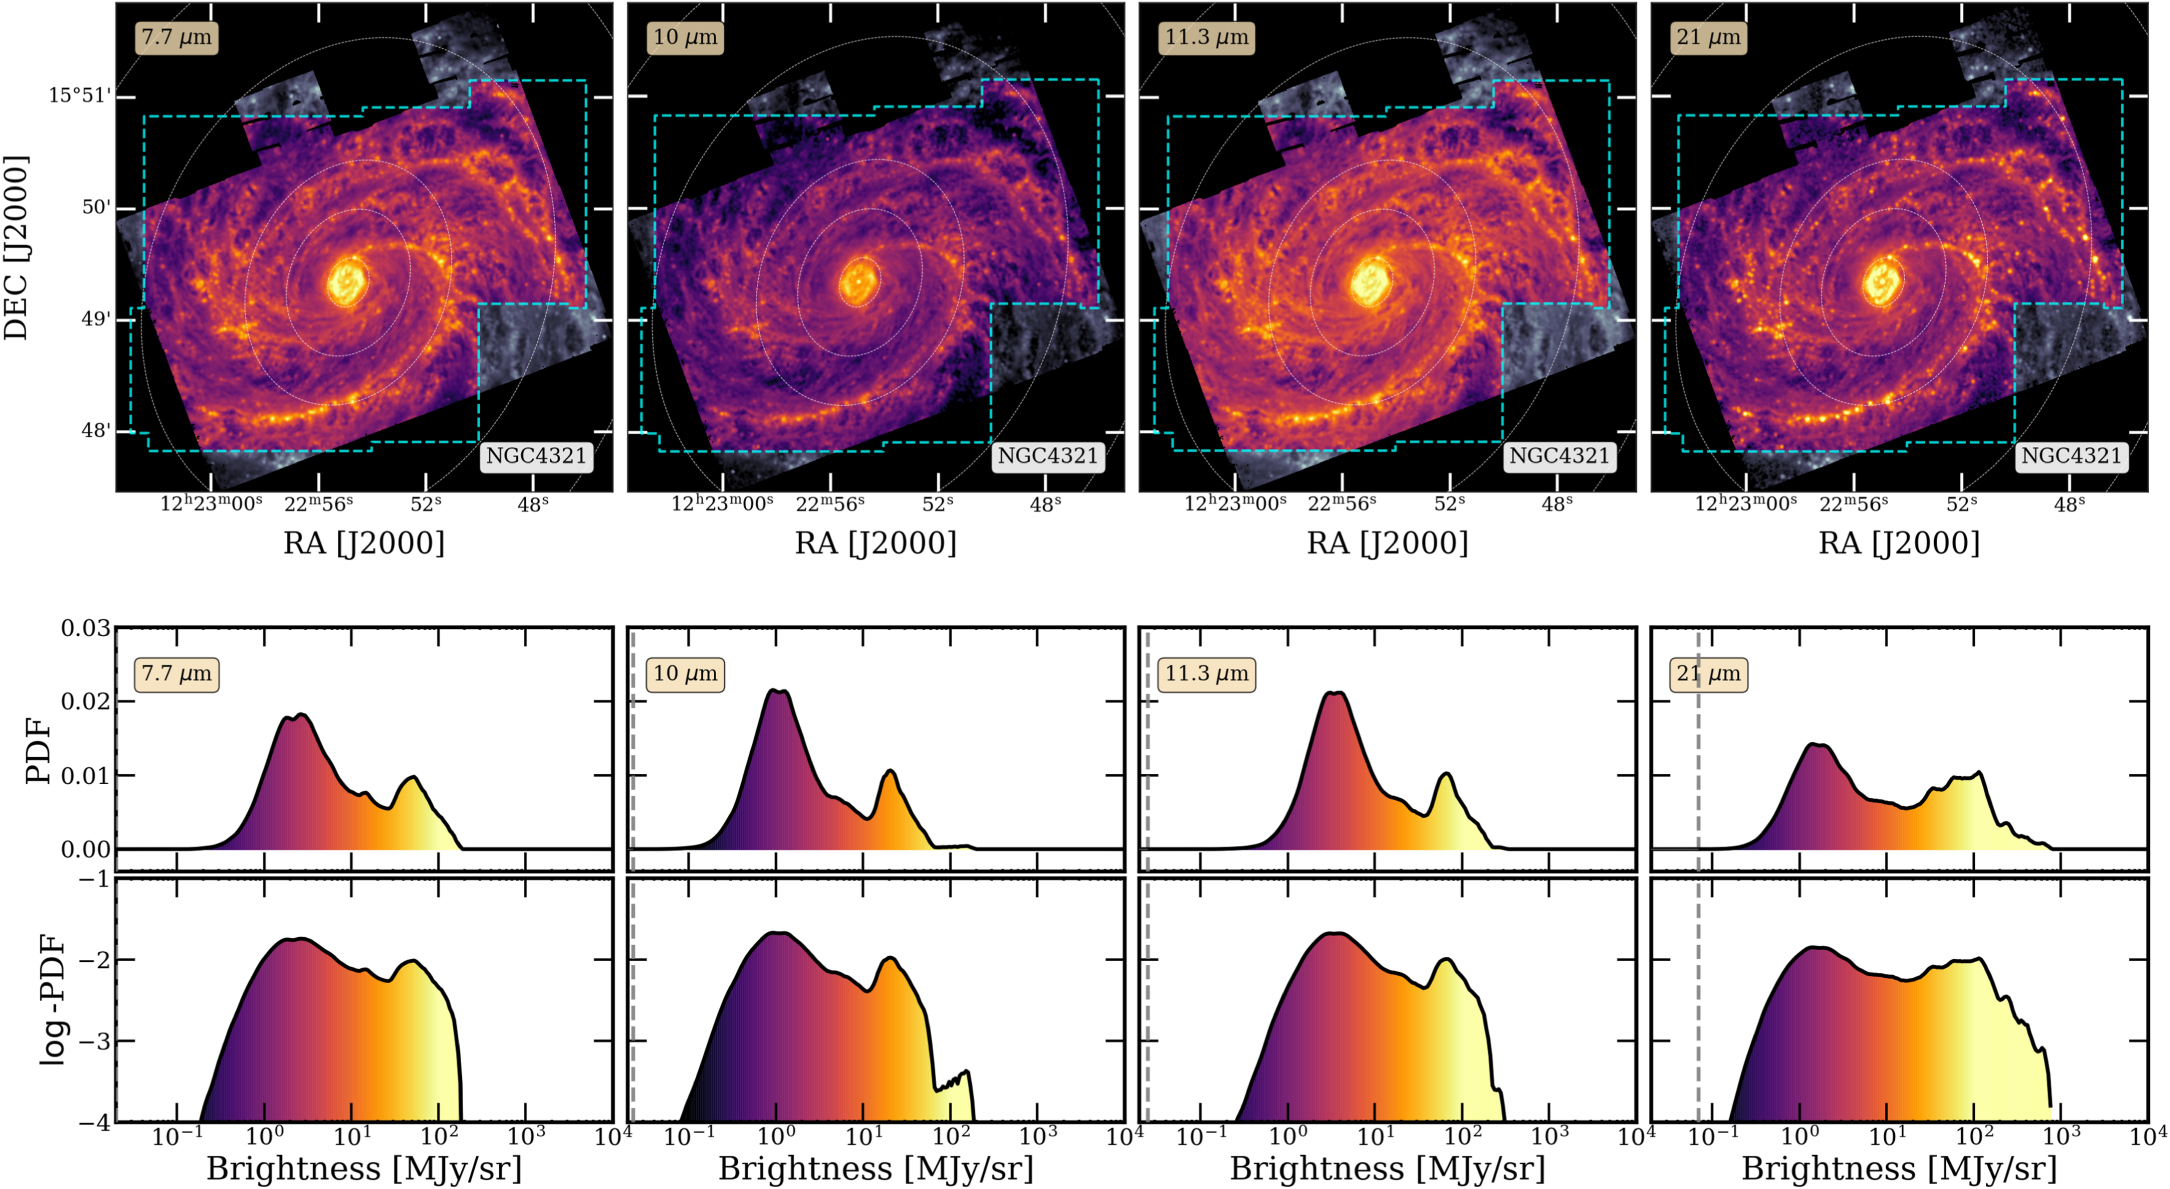
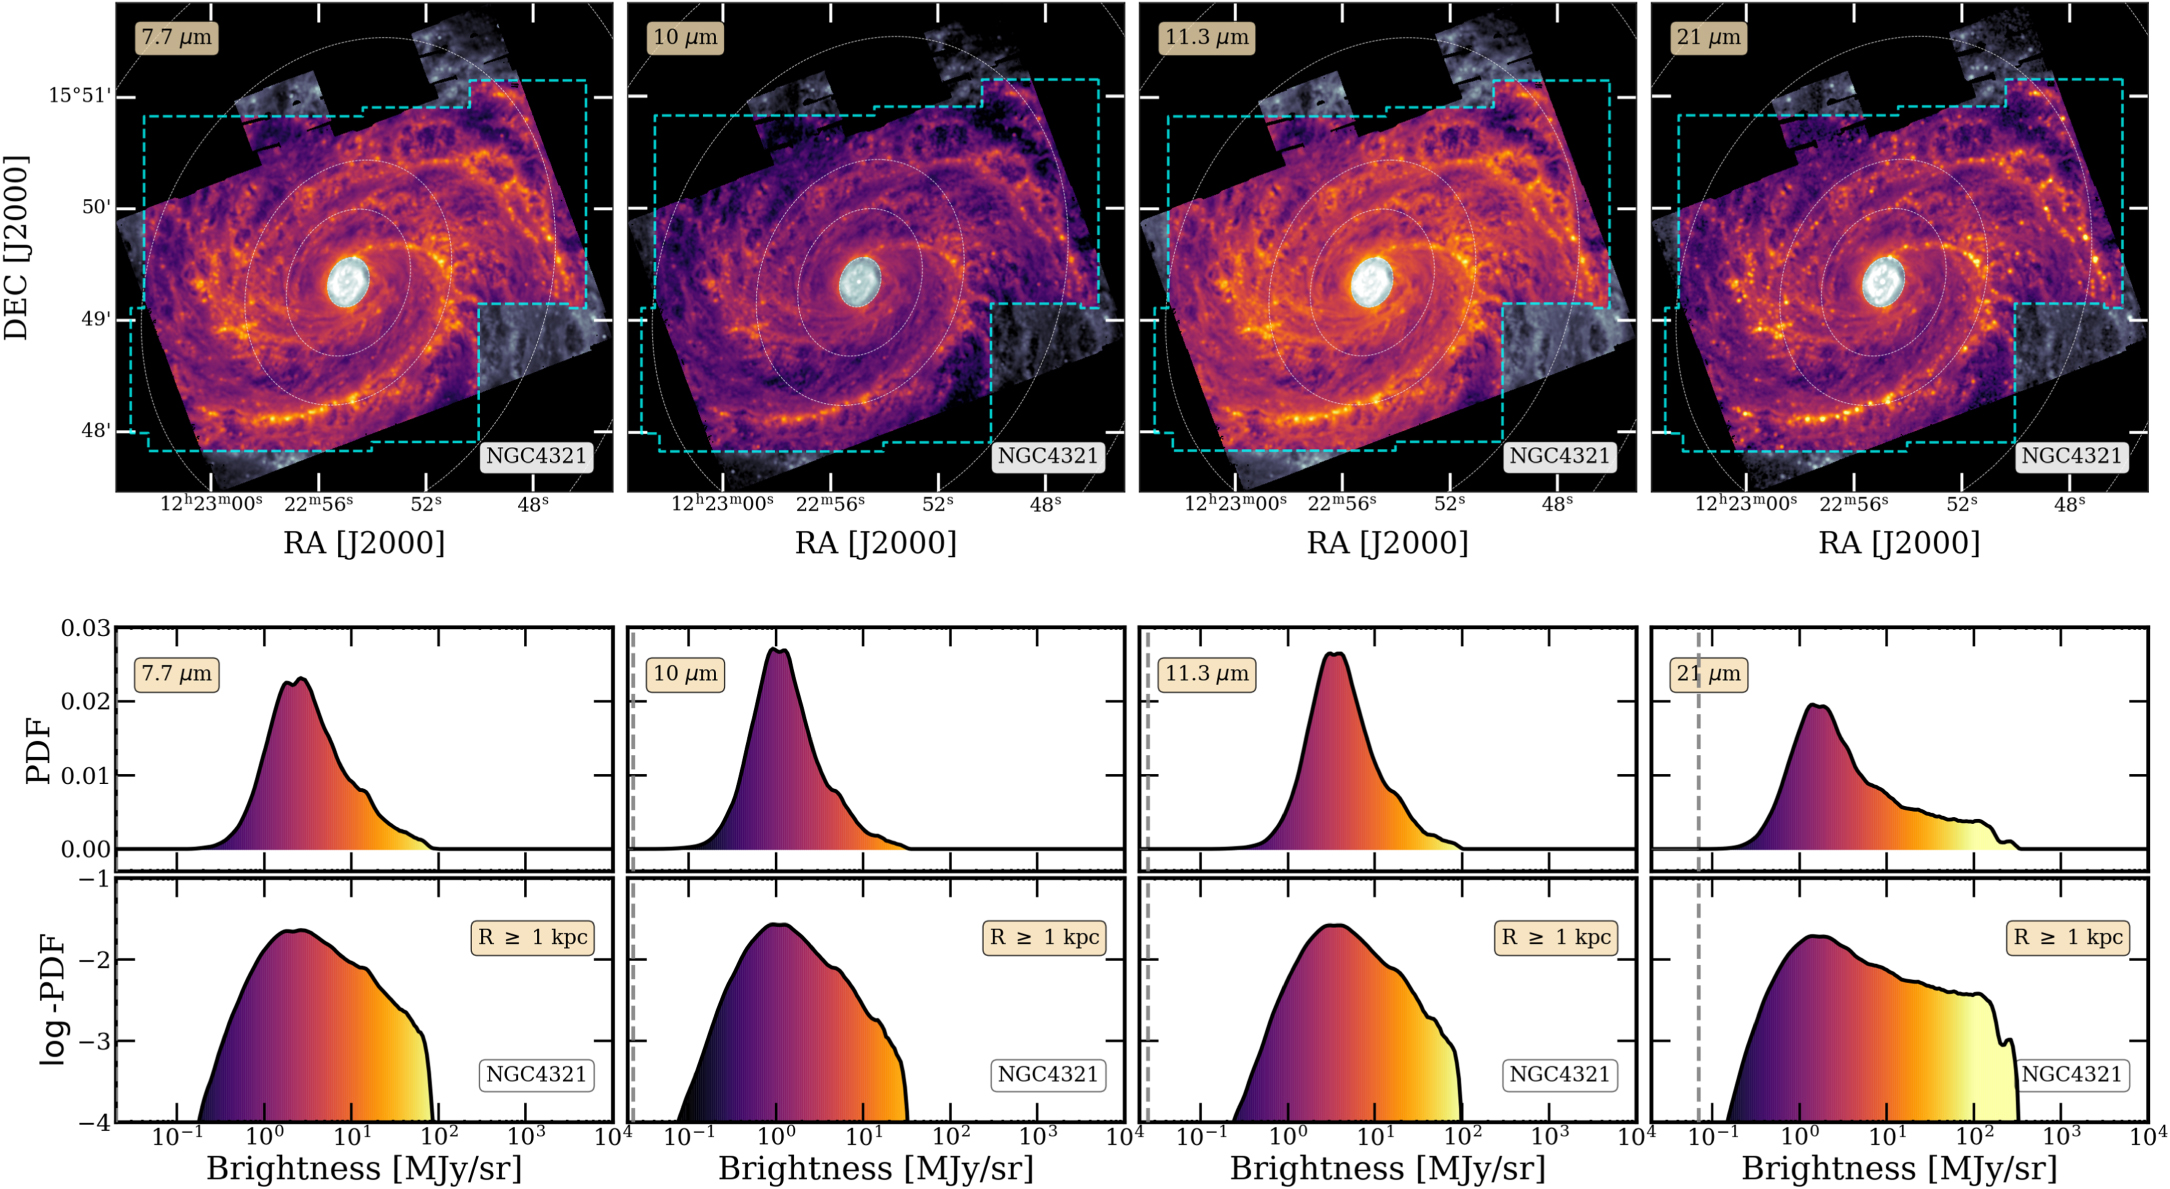
Figure 1. Images and PDFs of emission at 7.7, 10, 11.3, and 21 μm for NGC 4321 at 0.″85 (60 pc) resolution. Top: JWST images for NGC 4321 in each MIRI filter, restricted to the footprint of JWST-MUSE coverage (∼10 kpc; dashed blue). Middle: PDFs of inclination-corrected intensity from each image. The colors in the PDF map to the color bar in intensity used to display each image. Vertical dashed lines indicate the rms noise level in each filter at 0.″85. Bottom: the same PDF as in the middle row, but now with the y-axis on a logarithmic stretch to highlight features at the high-intensity end.
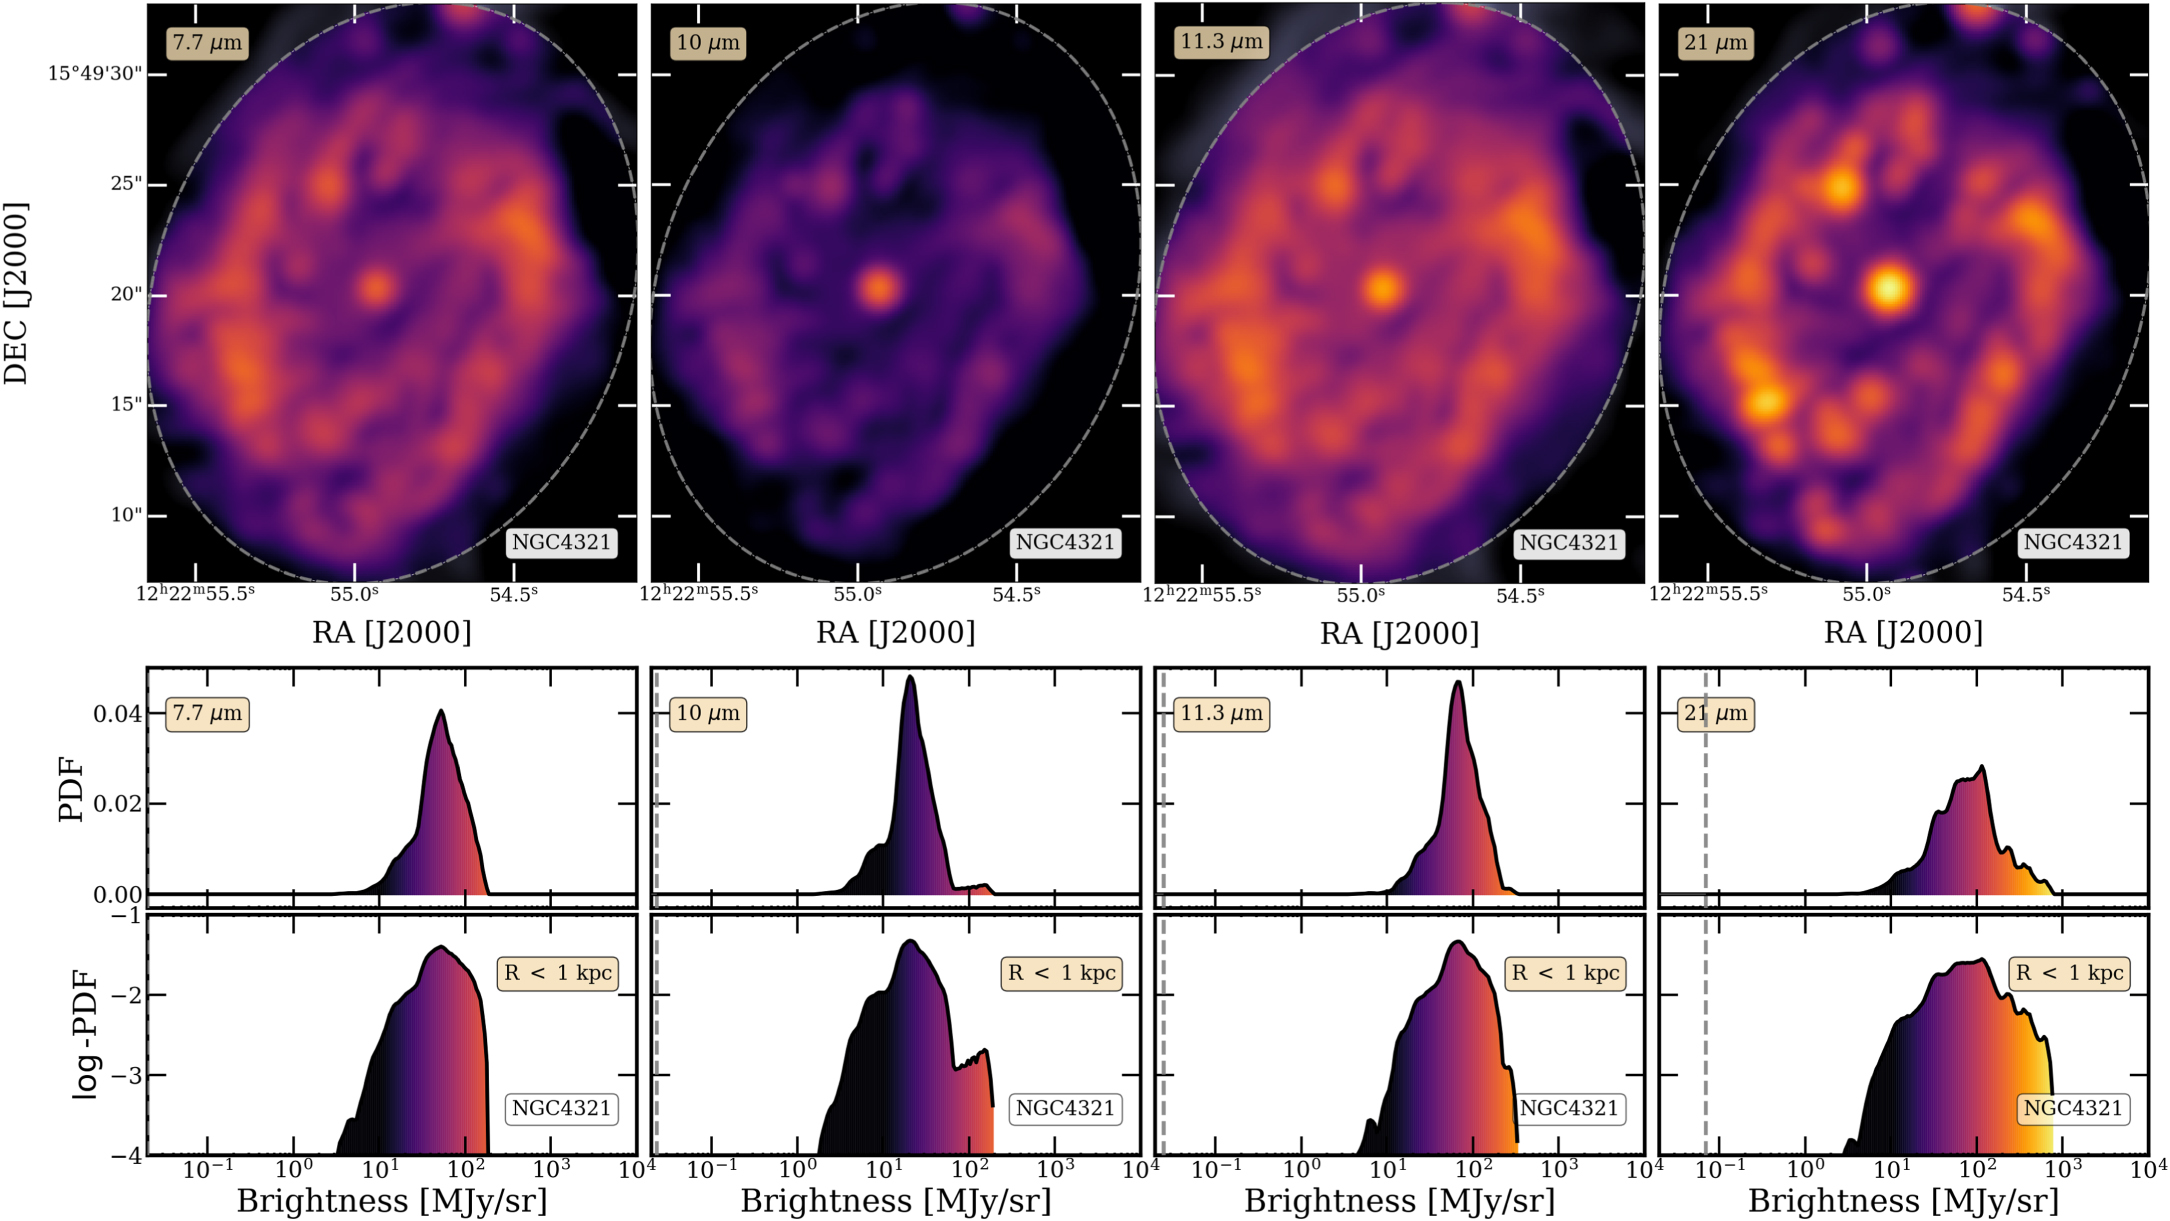
Figure 2. Images and PDFs of emission from the central 1 kpc at 7.7, 10, 11.3, and 21 μm for NGC 4321. Top: images of the central 1 kpc in NGC 4321 in each MIRI filter. Middle: pdf’s of inclination-corrected intensity from each image. The colors reflect the common color bar in intensity used to display each image. Bottom: the same PDFs as in the middle row, but now with the y-axis on a logarithmic stretch to highlight features at the high-intensity end.
Figure 3. The PDFs of emission of the galactic disk (r ≥ 1 kpc) after masking the center, at 7.7, 10, 11.3, and 21 μm for NGC 4321. Top: images of the galactic disk of NGC 4321 in each MIRI filter, with the masked central region shaded. Middle: PDFs of inclination-corrected intensity from each image excluding the masked central region. The colors in the PDF reflect the color bar in intensity used to display each image. Vertical dashed lines indicate rms noise levels in each filter. Bottom: the same disk-only PDFs shown in the middle row, but now with the y-axis in log-stretch to highlight features at the high-intensity end. The PDFs of the disk show a consistent lognormal component that peaks at lower intensities, as well as a high-intensity tail that can be roughly approximated to a power law.
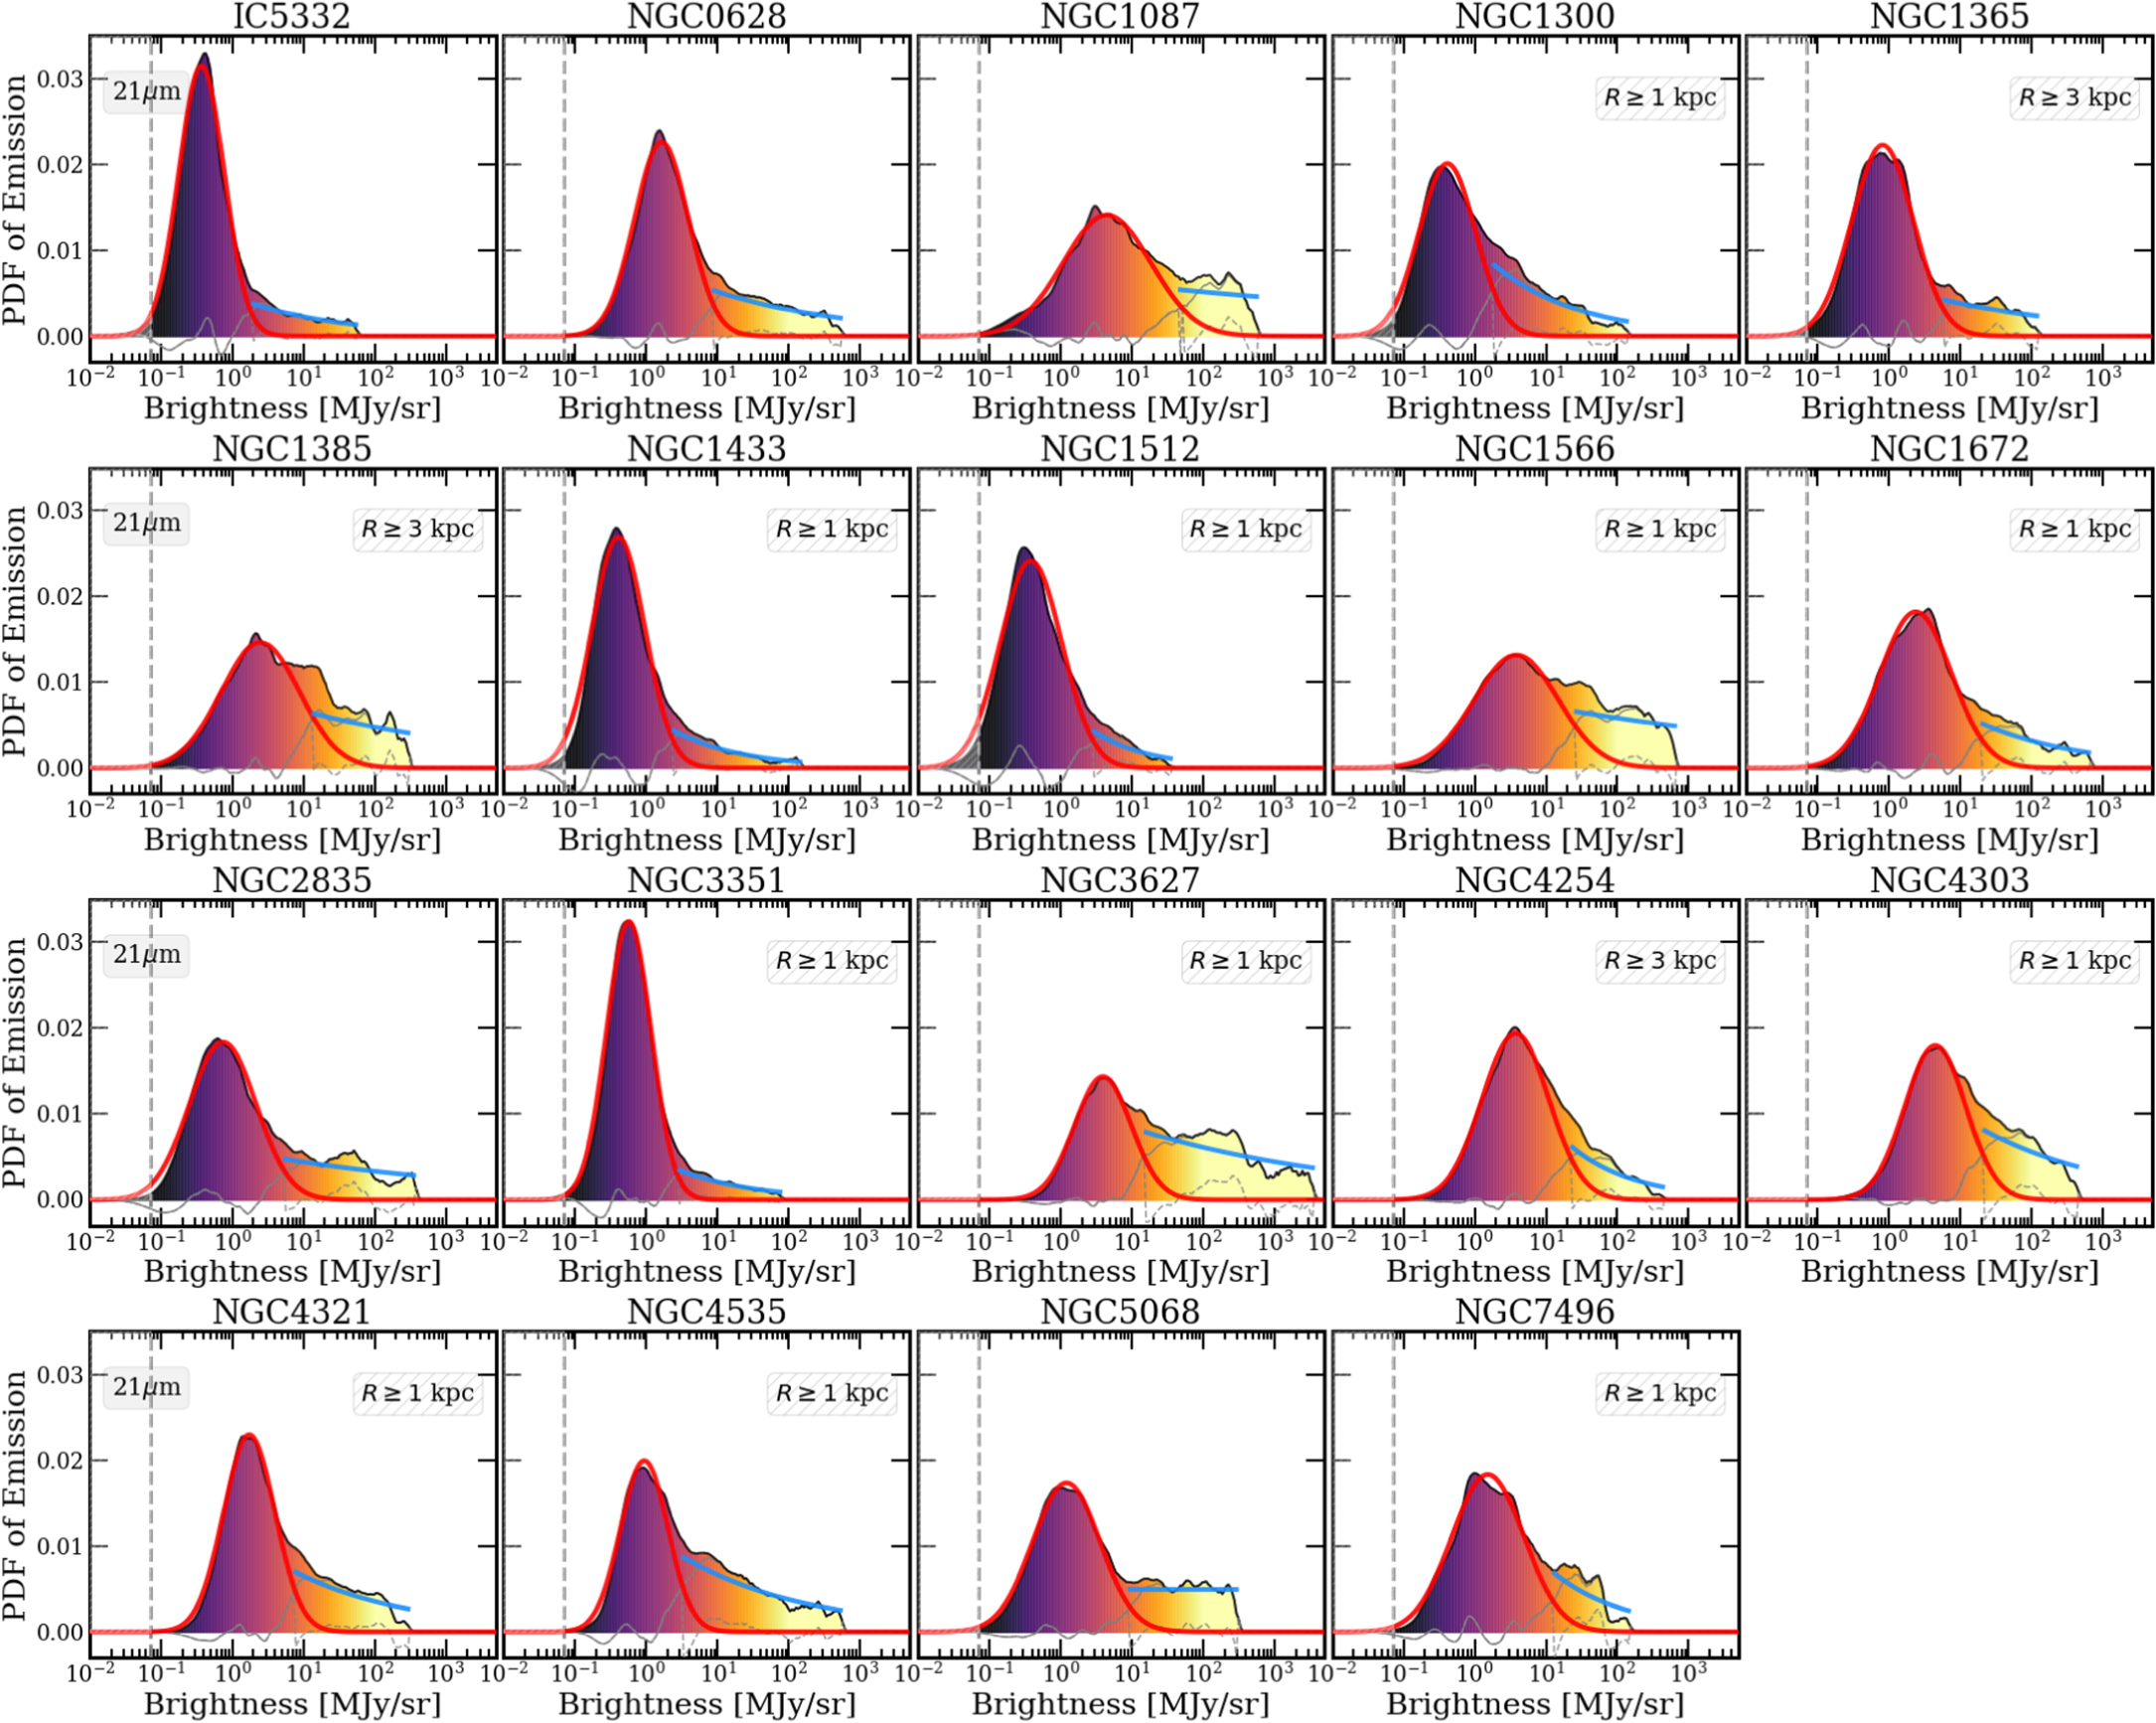
Figure 4. The PDFs of the galactic disk (in black) for our full sample at 21 μm. Vertical dashed lines show the rms noise levels for 21 μm at 0.″85. The PDFs at each filter show an overall distribution well fit by a lognormal (red) at lower intensity (residuals in gray), with high-intensity residuals (dashed gray) that are well fit by a power law (blue).
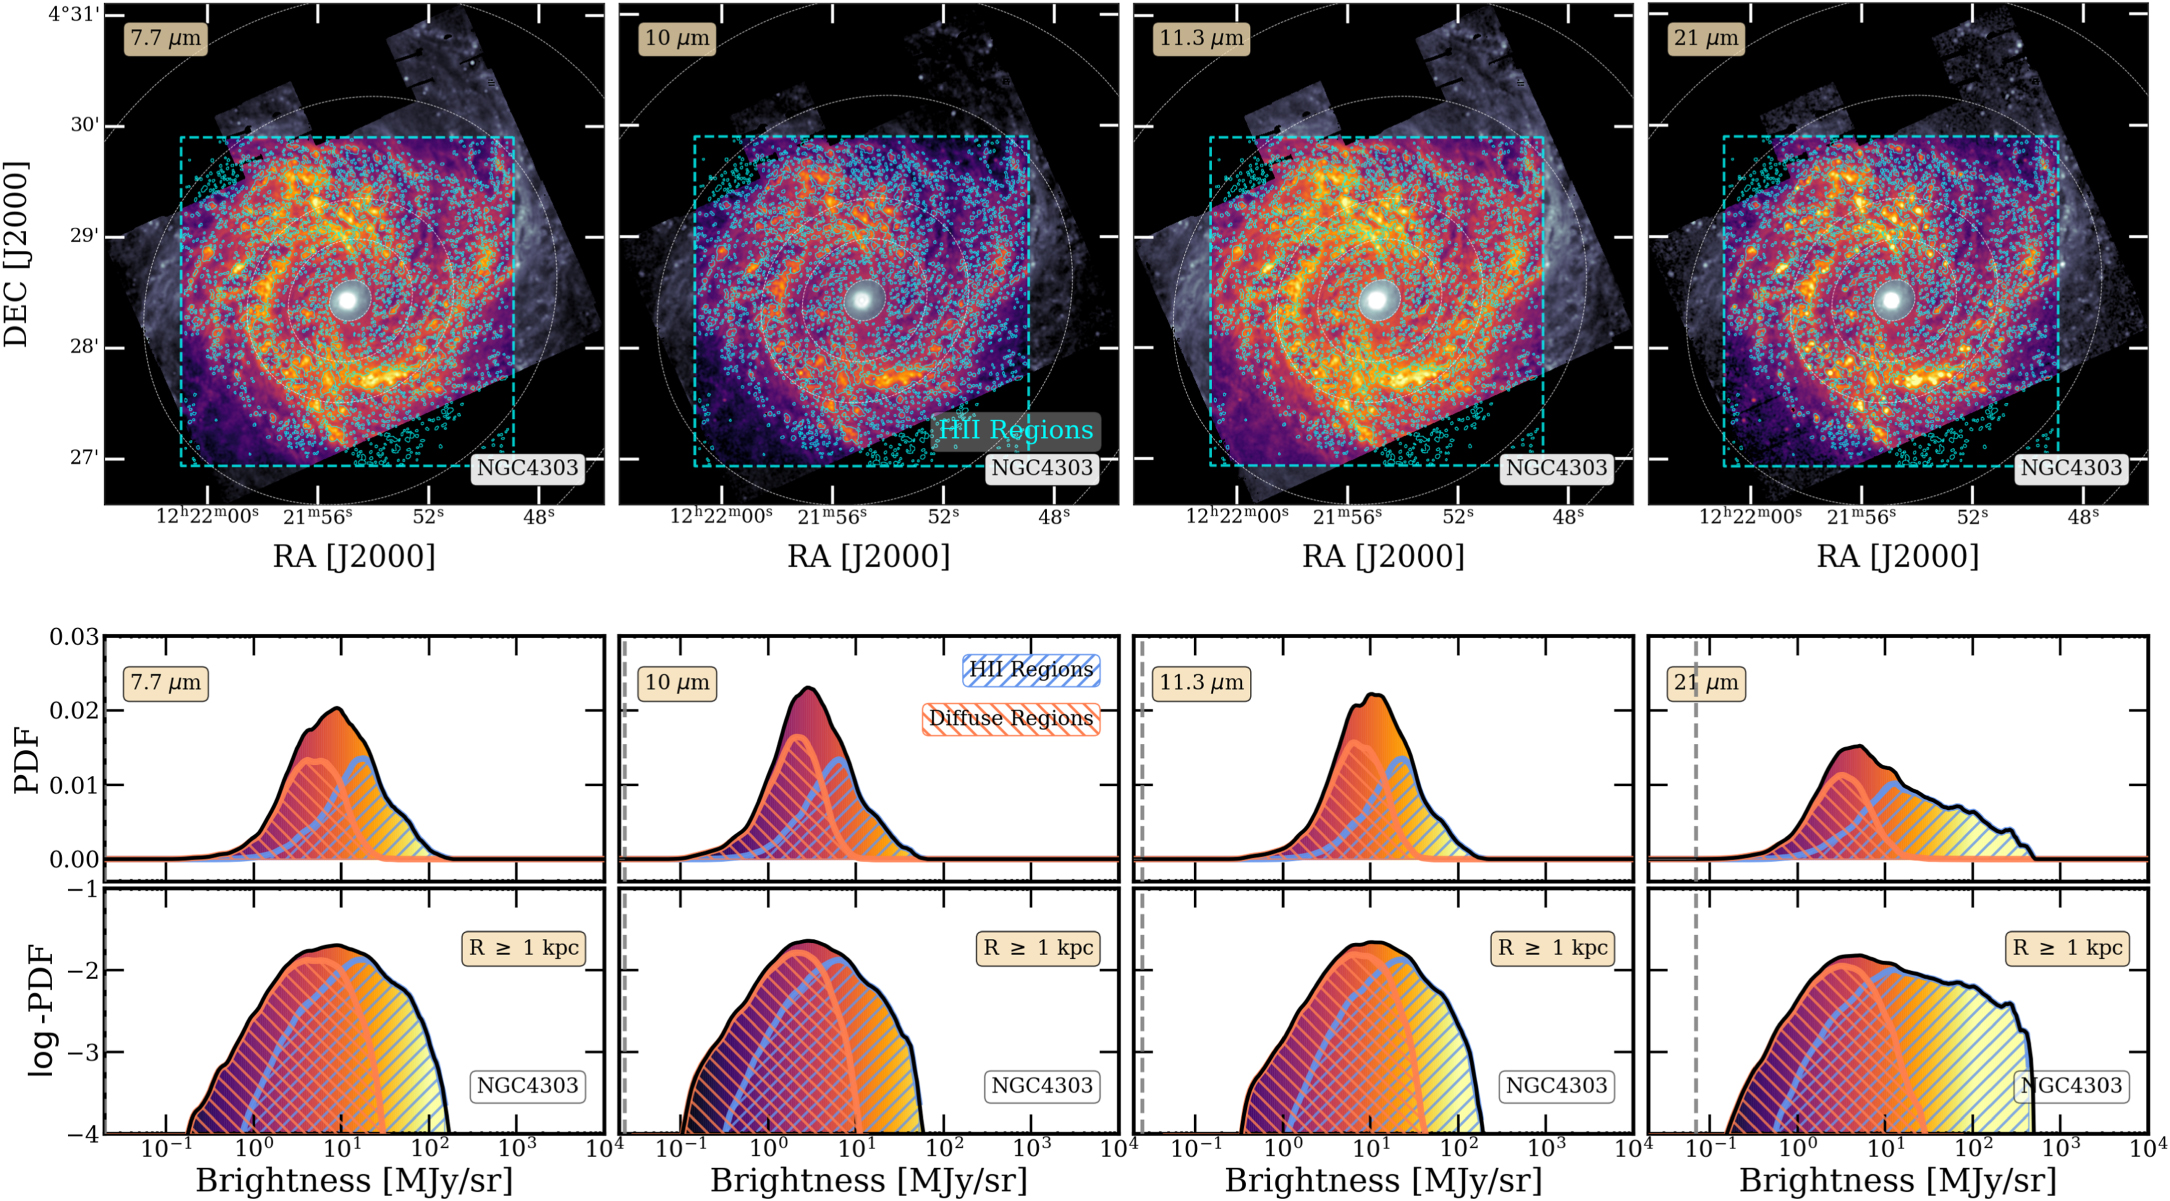
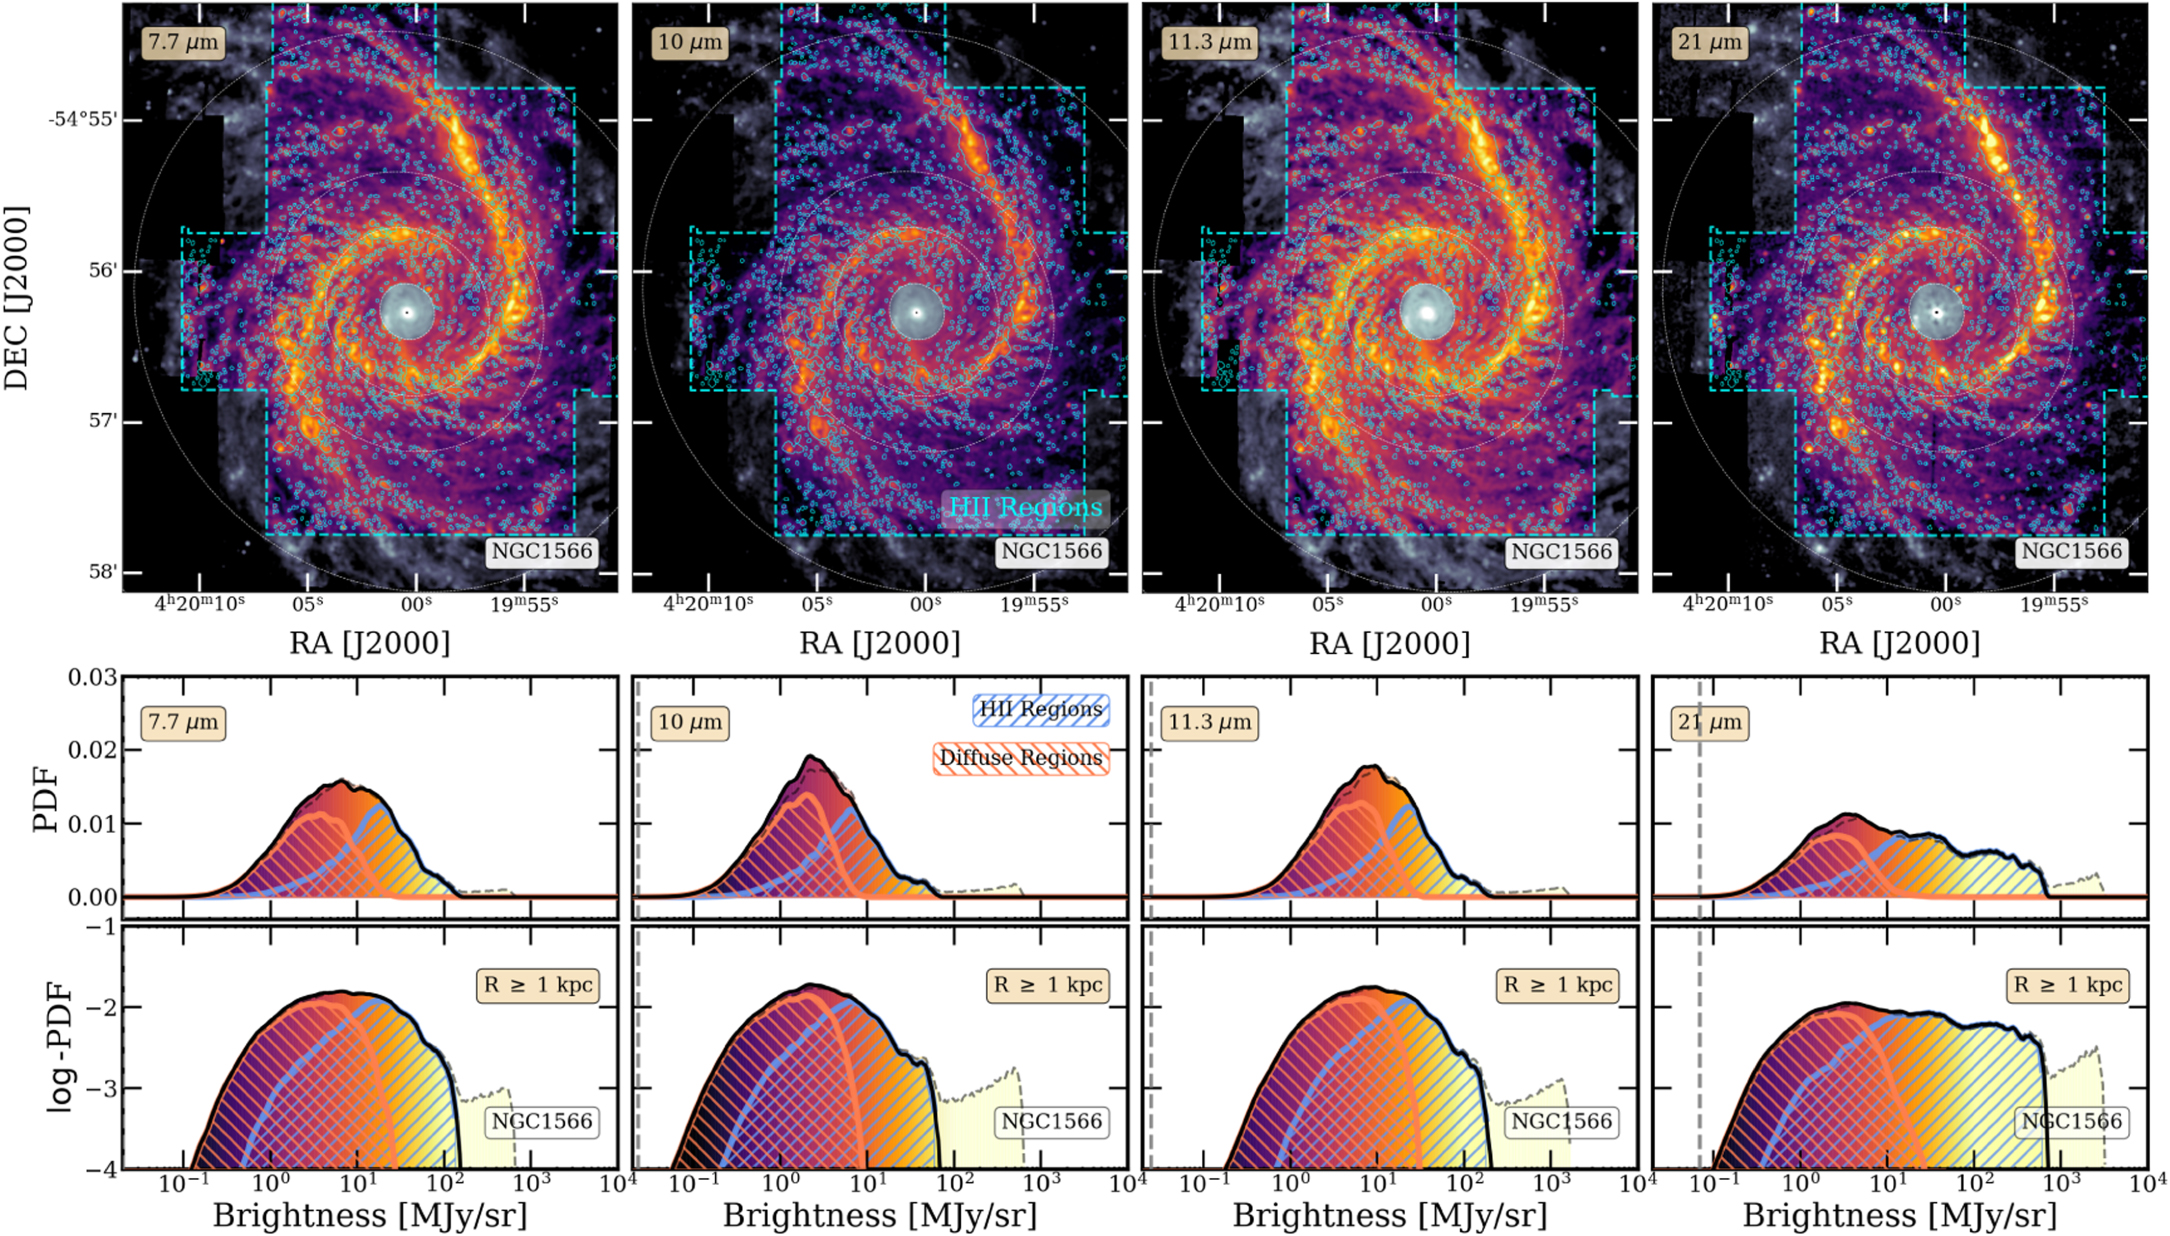
Figure 5. The PDFs of emission of the galactic disk (r ≥ 1 kpc) after masking the center, at 7.7, 10, 11.3, and 21 μm for NGC 4303, tagged by emission from within and outside of H II regions. Top: images of the galactic disk of NGC 4303 in each MIRI filter, with the masked central region shaded. Hα-identified H II regions are overlaid in blue contours. Middle: PDFs of inclination-corrected intensity from the disk (excluding the masked central region), colored by the intensity color bar used to display each image. The PDFs of emission from within H II regions and outside of H II region masks are included in hatched blue and orange, respectively. Bottom: the same disk-only PDFs shown in the middle row, but now with the y-axis in log-stretch to highlight the power-law tail. It is evident that the emission from H II regions builds up the power-law component, and the diffuse ISM outside of H II regions shows a lognormal PDF.
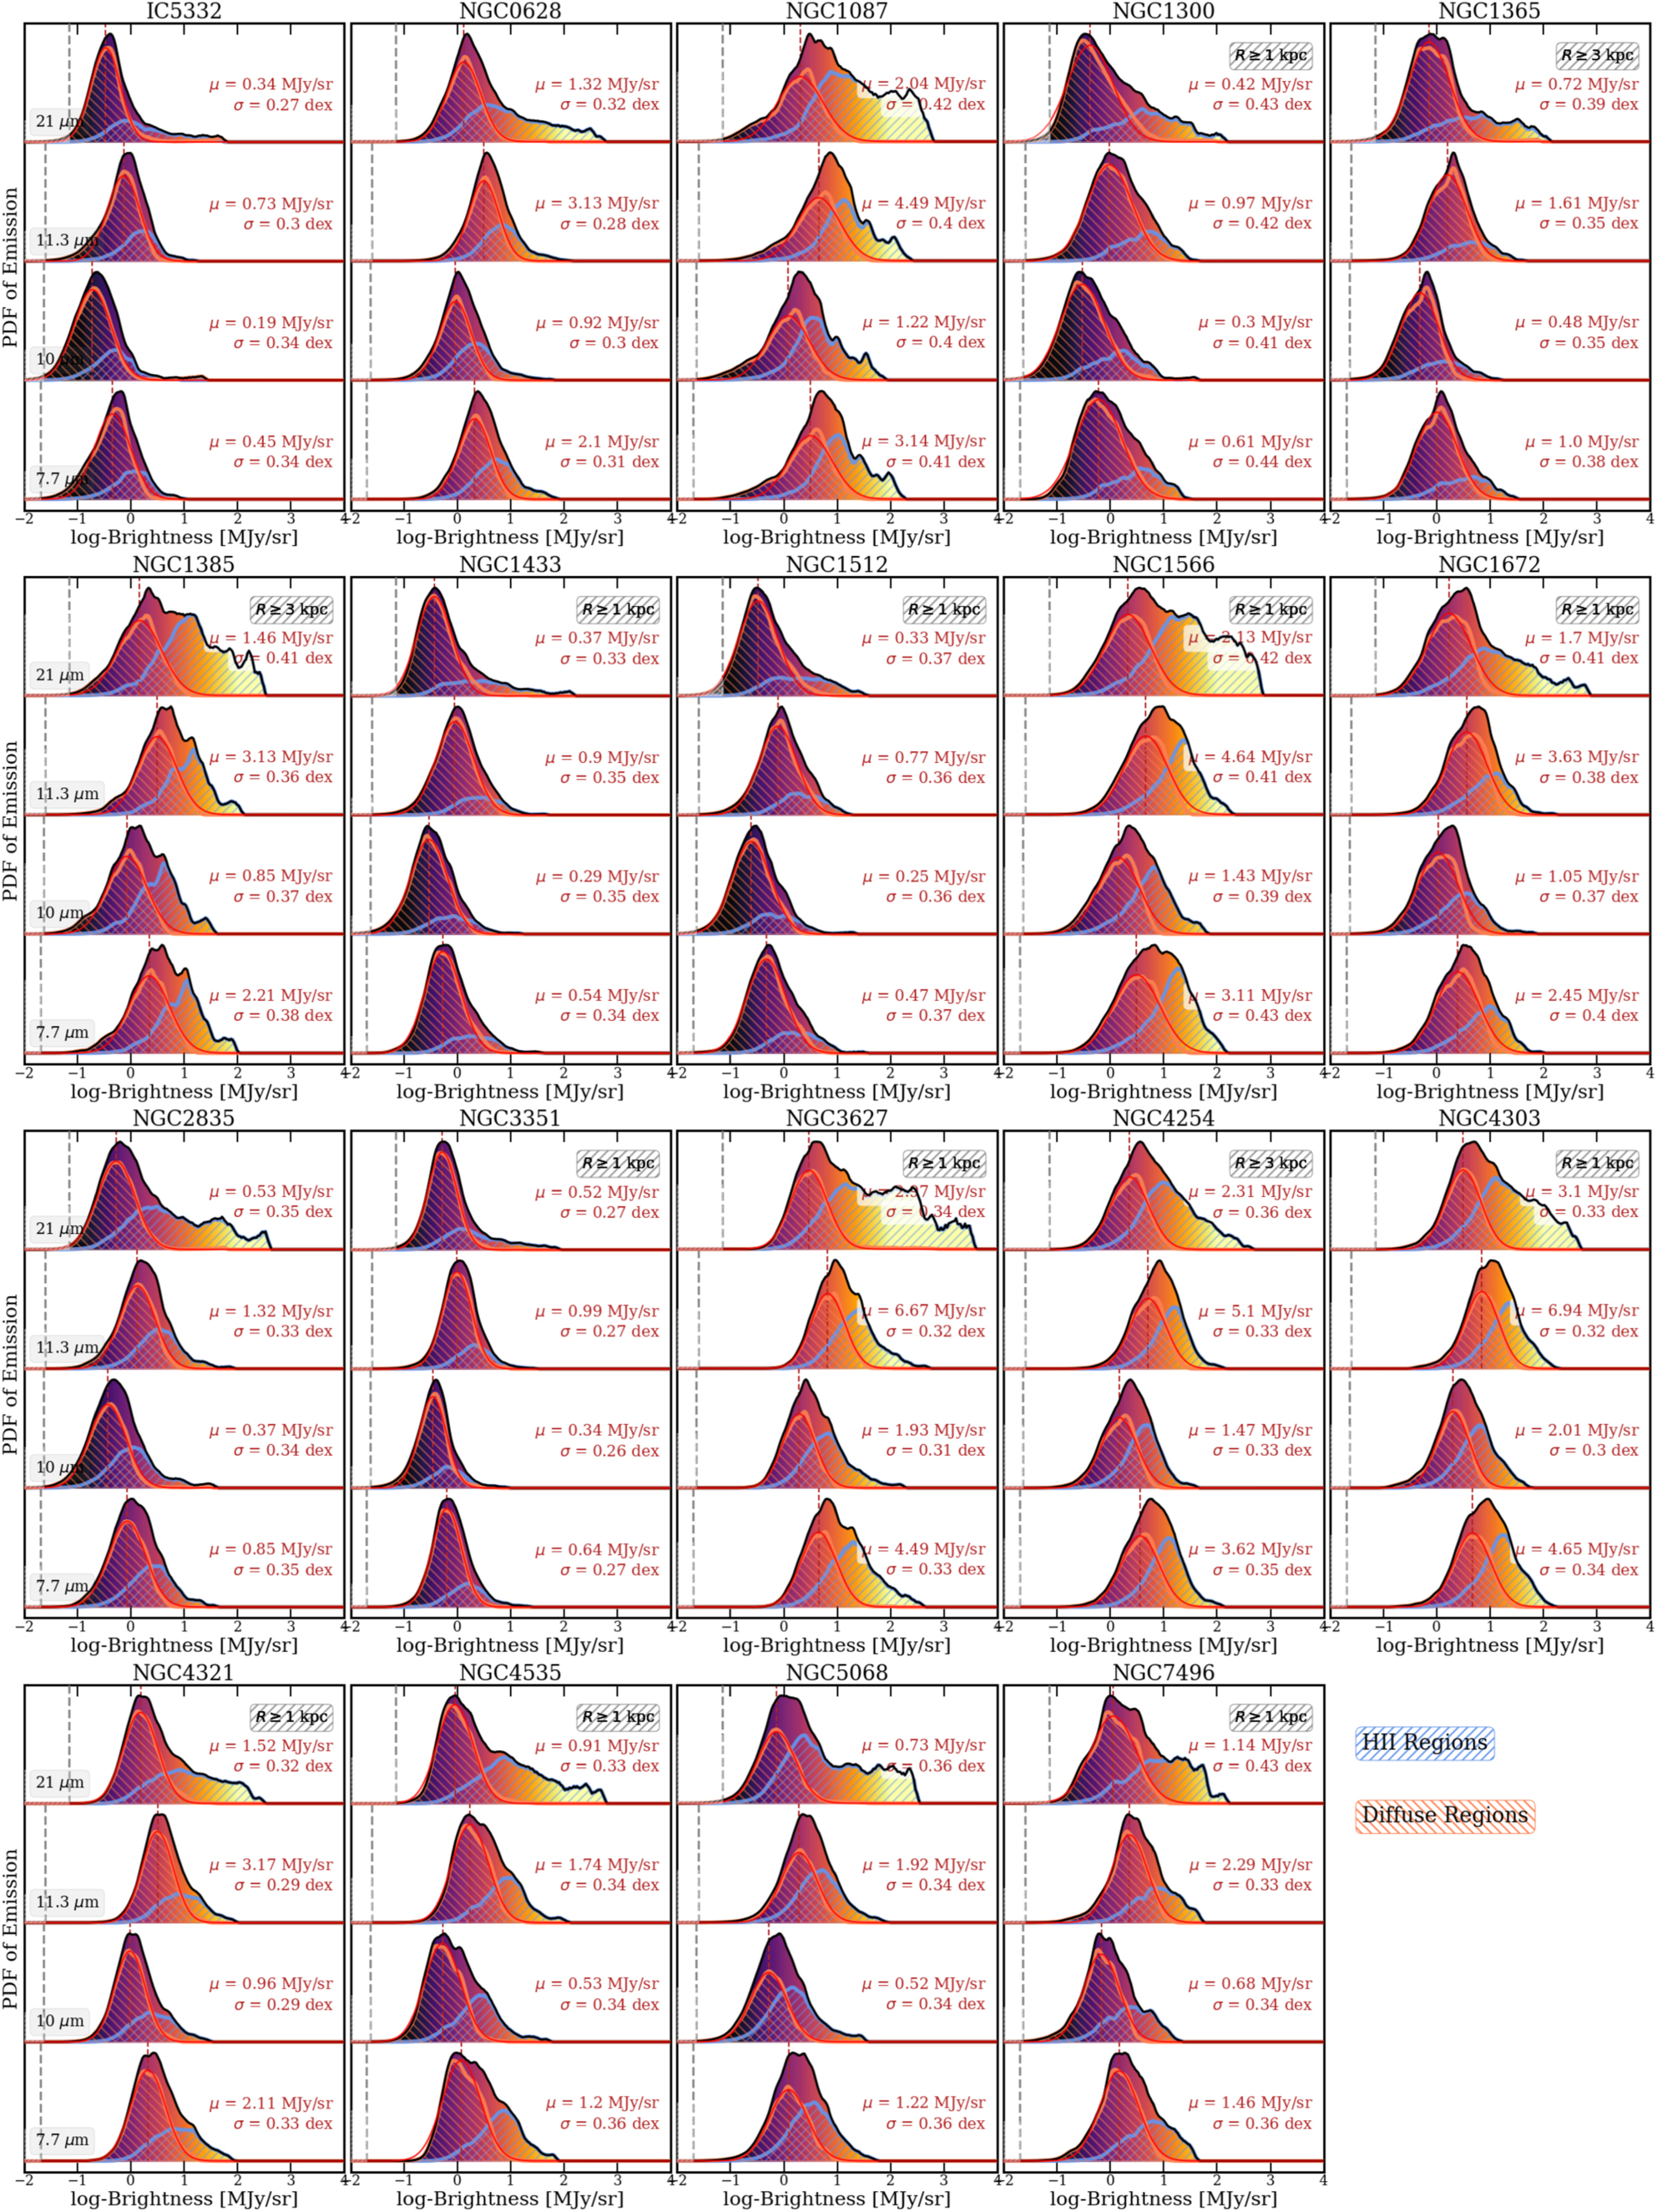
Figure 6. The galactic disk PDFs (in black) of our full sample of 19 galaxies at 7.7, 10, 11.3, and 21 μm show an overall lognormal distribution with a power-law tail at higher intensities. The power law component can be primarily attributed to emission from individual H II regions (blue), and the lognormal component comes from emission from outside H II regions (red). Vertical dashed lines indicate the rms noise level in each filter for reference. The best-fit lognormal mean μ and dispersion σ are included for each PDF.
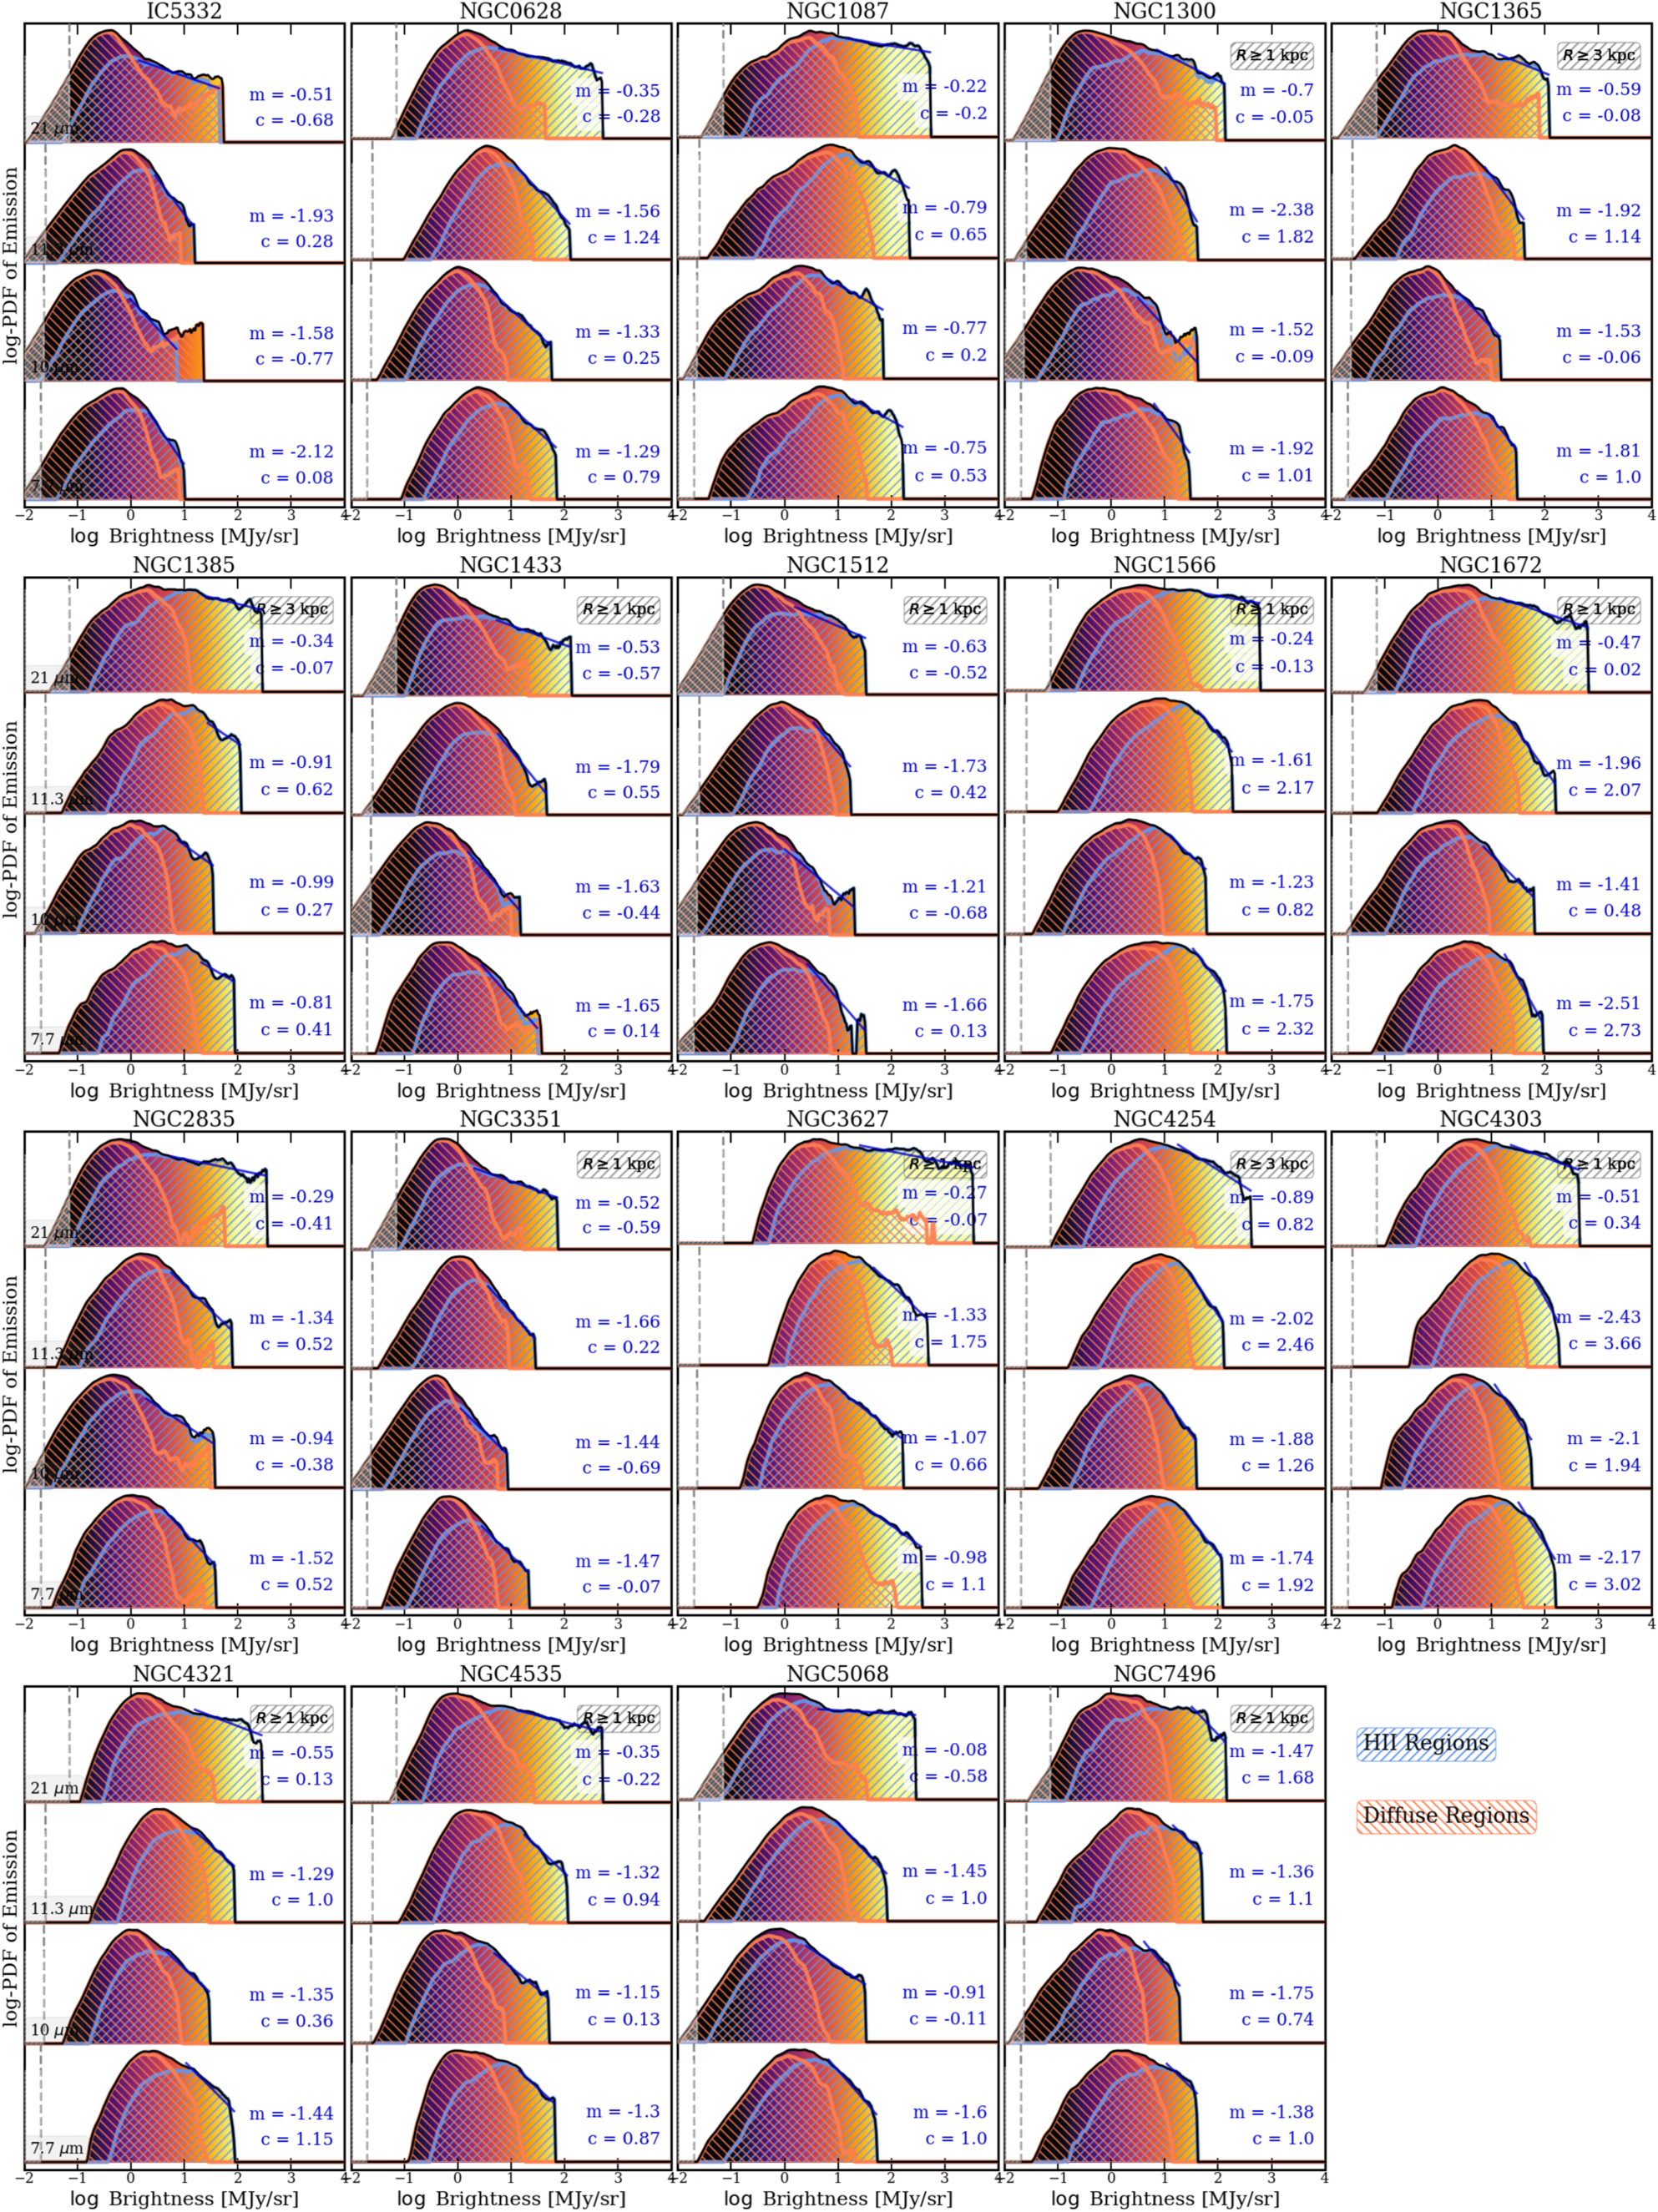
Figure 7. The disk PDFs (in black) of our sample of 19 galaxies at 7.7, 10, 11.3, and 21 μm decomposed by contributions from H II regions (blue) and outside (red). These are the same PDFs as in Figure 6, but in log-stretch to highlight the power-law component. The best-fit power law is shown in dark blue. The corresponding best-fit H II region power-law index m and log–log intercept c for each PDF are included for each panel.
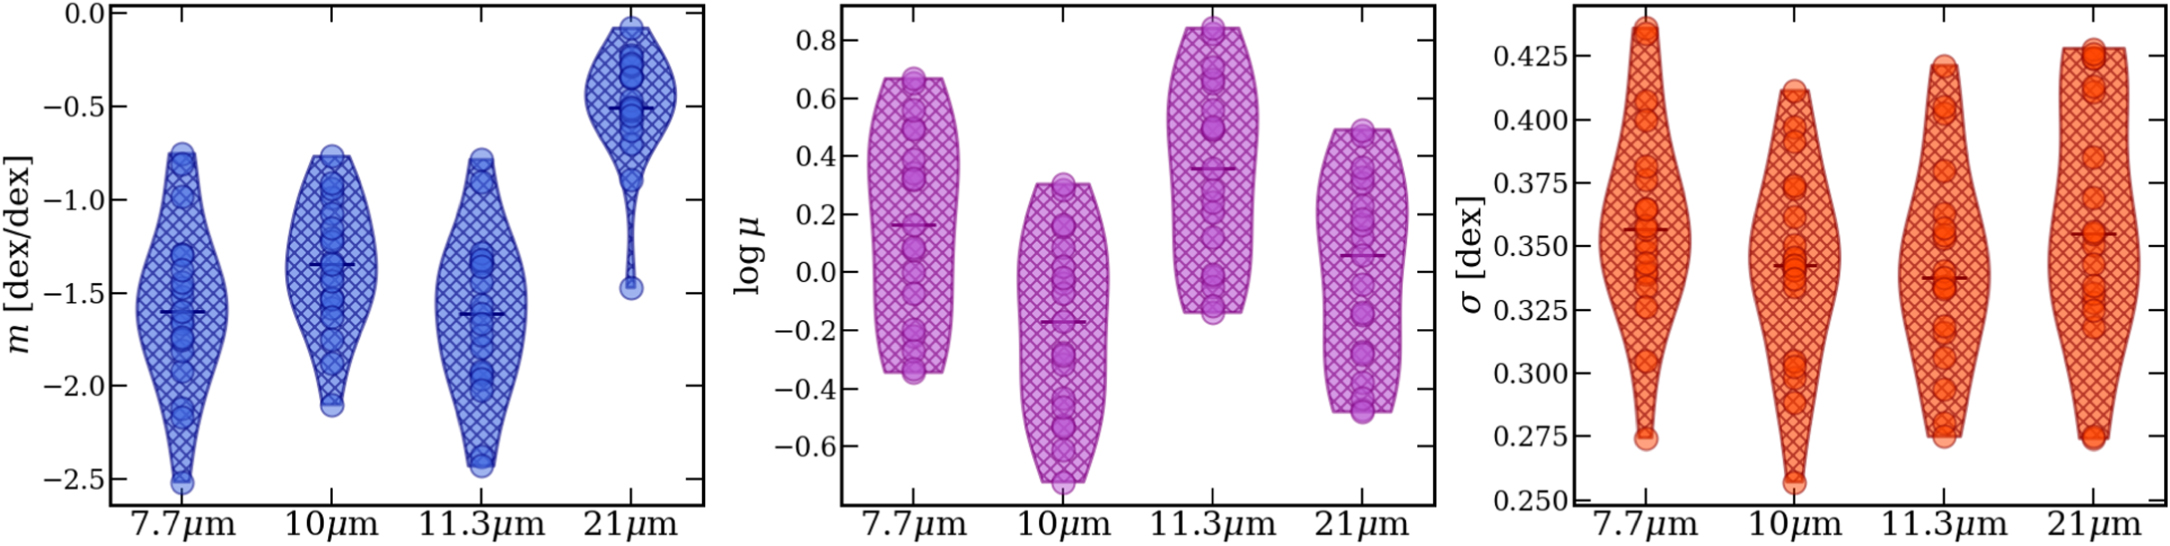
Figure 8. Summary of the galactic disk PDF parameters at each wavelength, including the H II region power-law index (m) in the left panel and the diffuse component lognormal mean (μ) and variance (σ) in the middle and right panels, respectively, as included in Table 2. The PDFs at 21 μm show significantly more pronounced power law components, while the mean intensity of the diffuse lognormal component is systematically higher in PAH-tracing 7.7 and 11.3 μm. The lognormal PDF widths remain generally consistent across the four filters.
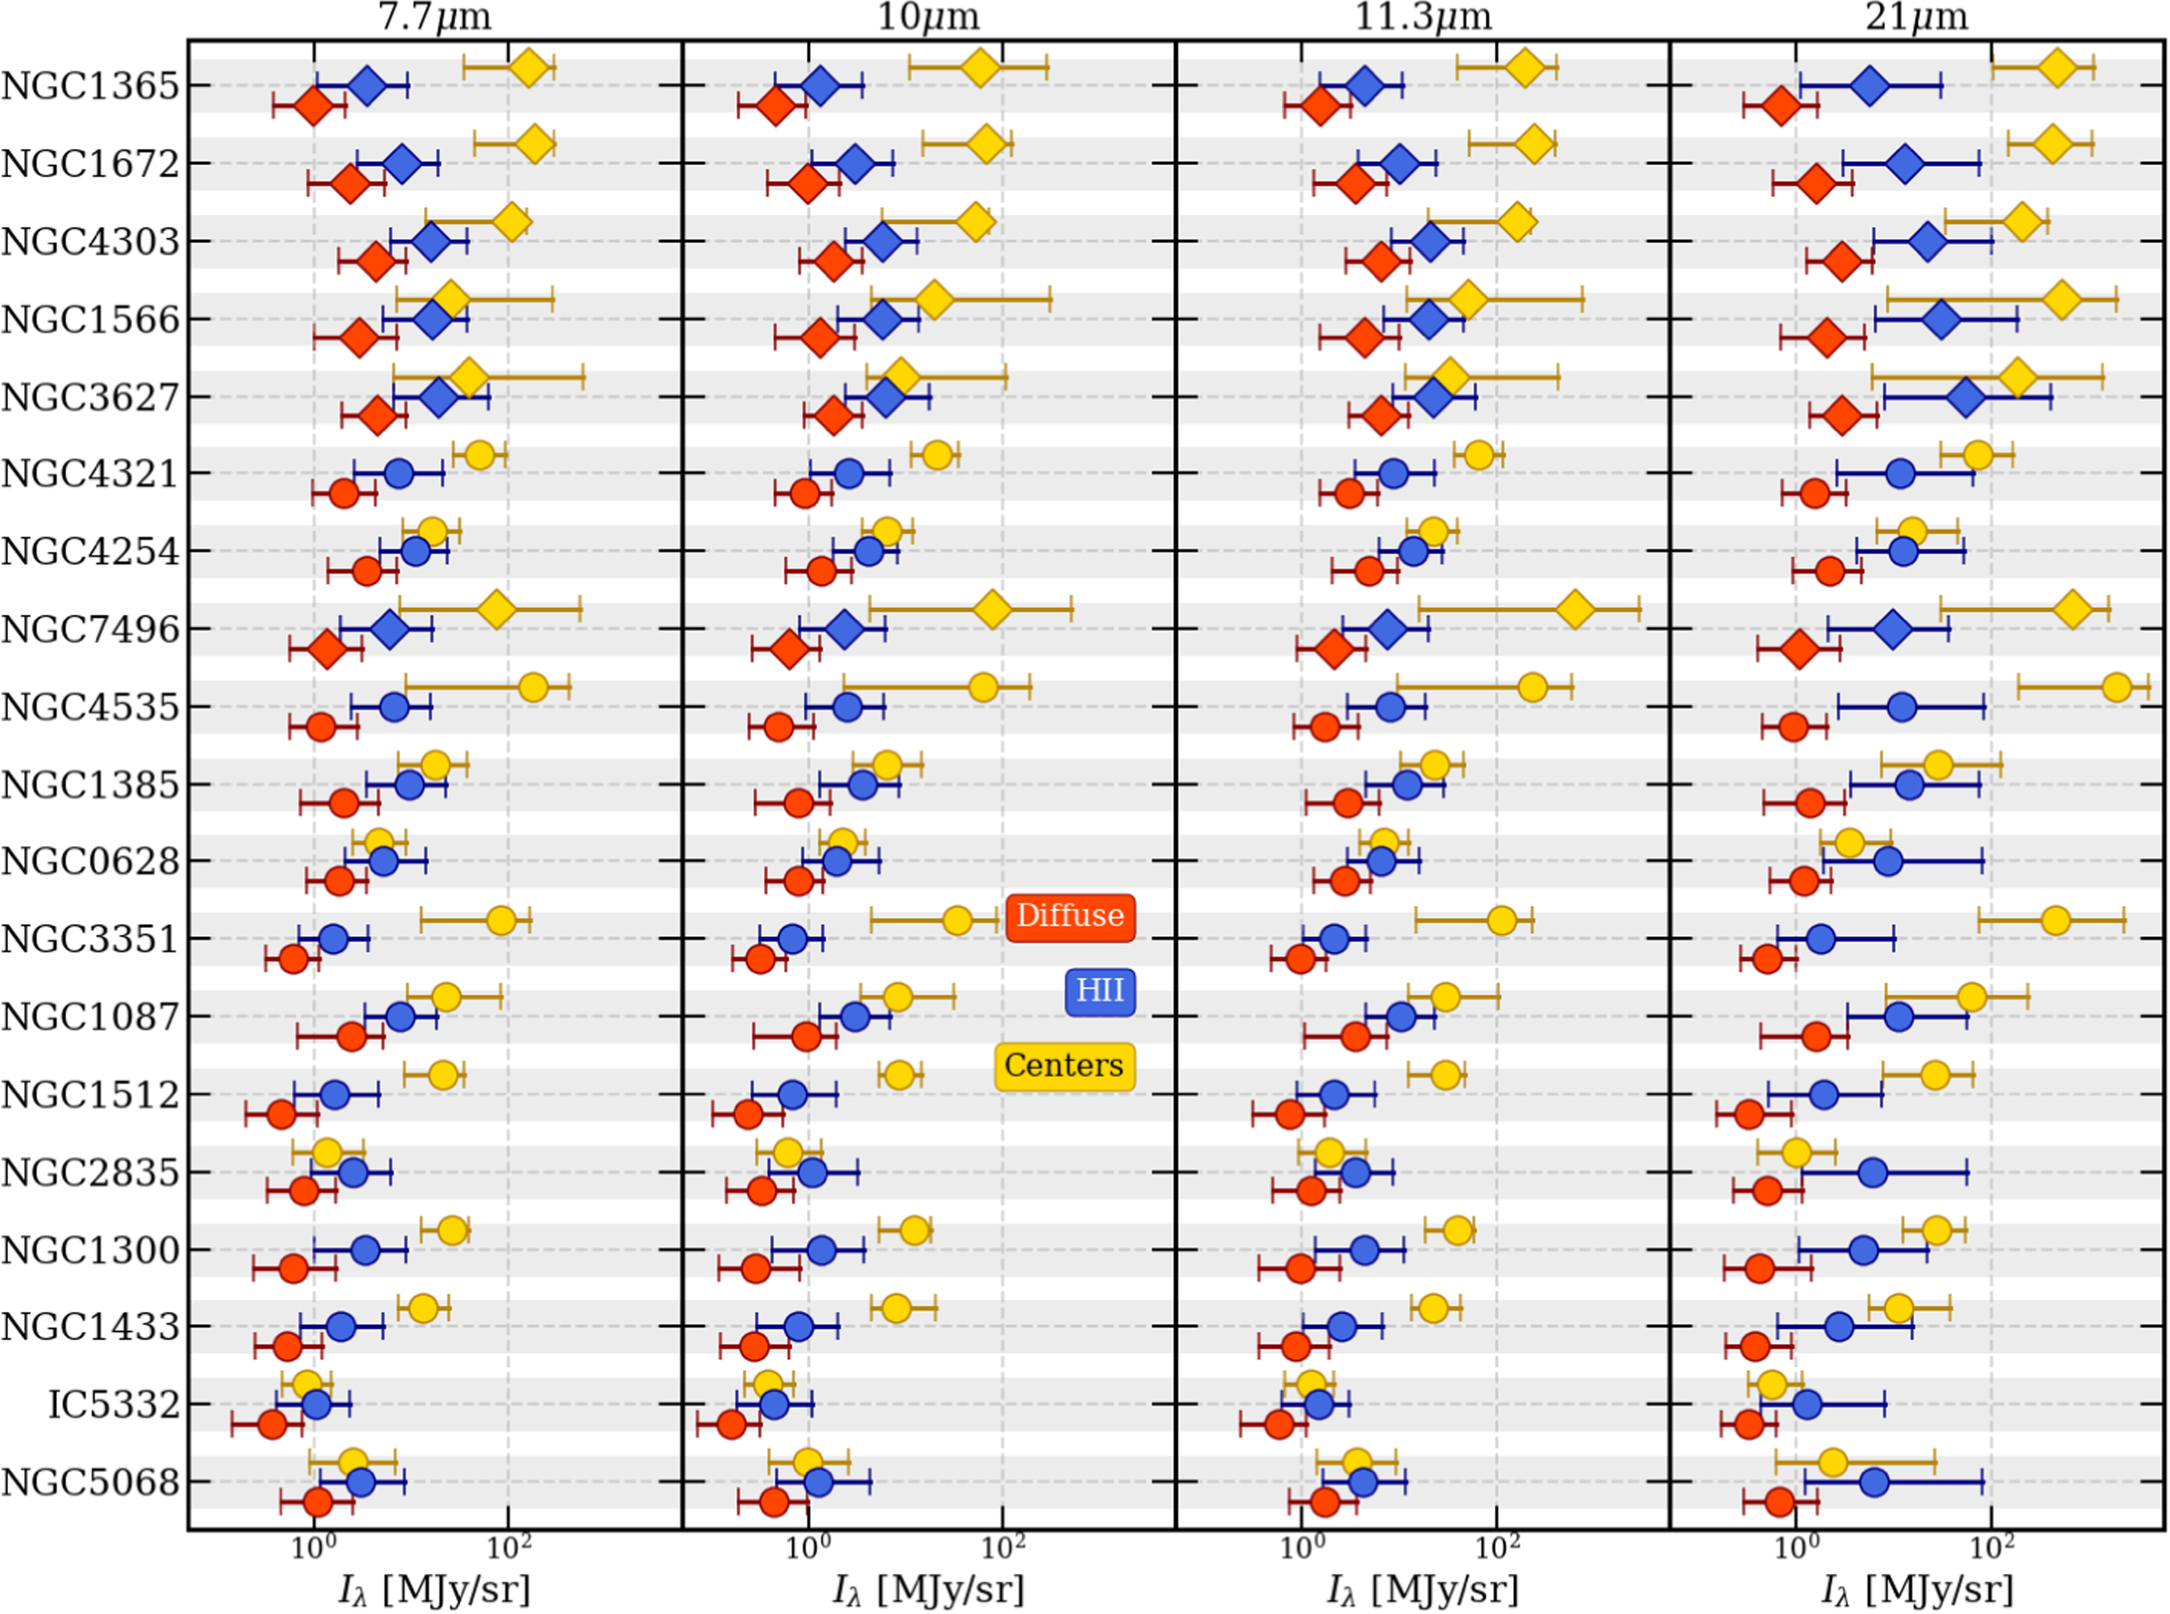
Figure 9. Median and 16th–84th range of mid-IR intensities in the diffuse ISM (red), H II region (blue), and central components (yellow) at 7.7, 10, 11.3, and 21 μm. AGN-classified galaxies (see Table 1 for AGN classification) are represented with diamonds. Targets are arranged in decreasing order of SFR from top to bottom. The overall brightness of both the disk and centers generally increases with SFR. The H II regions and centers (“bright” regions) show a significantly larger dynamical range of intensities at 21 μm.
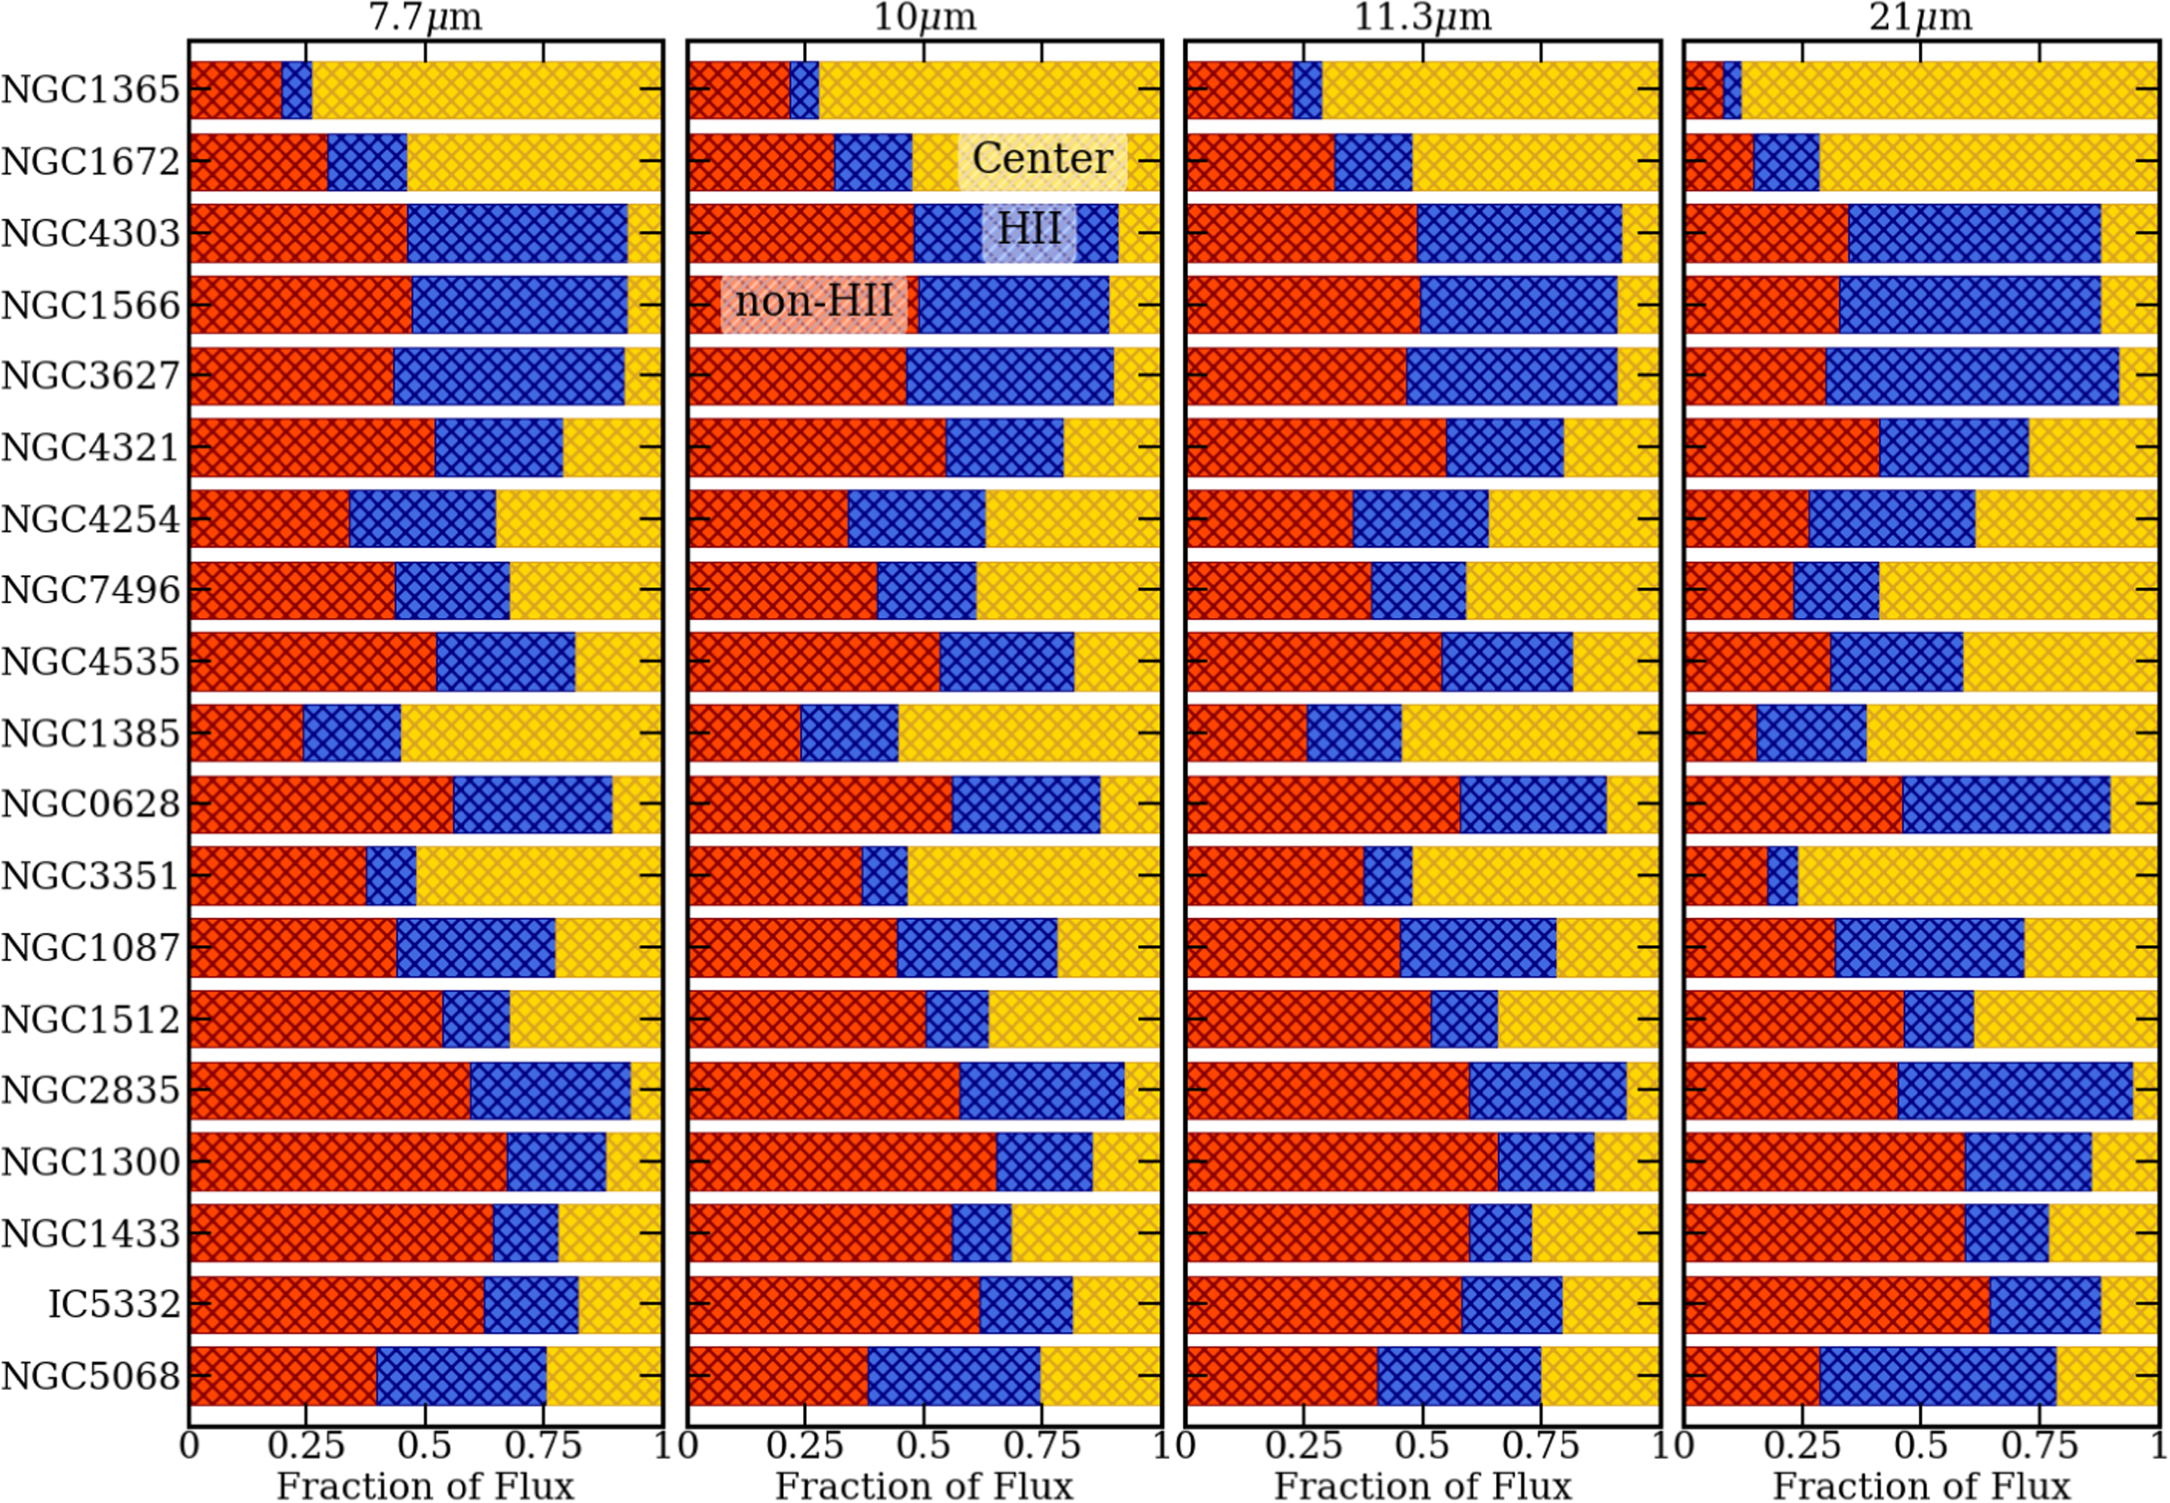
Figure 10. The fraction of total flux coming from the diffuse ISM (red), H II regions (blue), and central regions (yellow) at 7.7, 10, 11.3, and 21 μm. Targets are arranged in decreasing order of SFR from top to bottom. While the contribution from the centers varies, a significant fraction of the flux in the disk comes from diffuse emission.
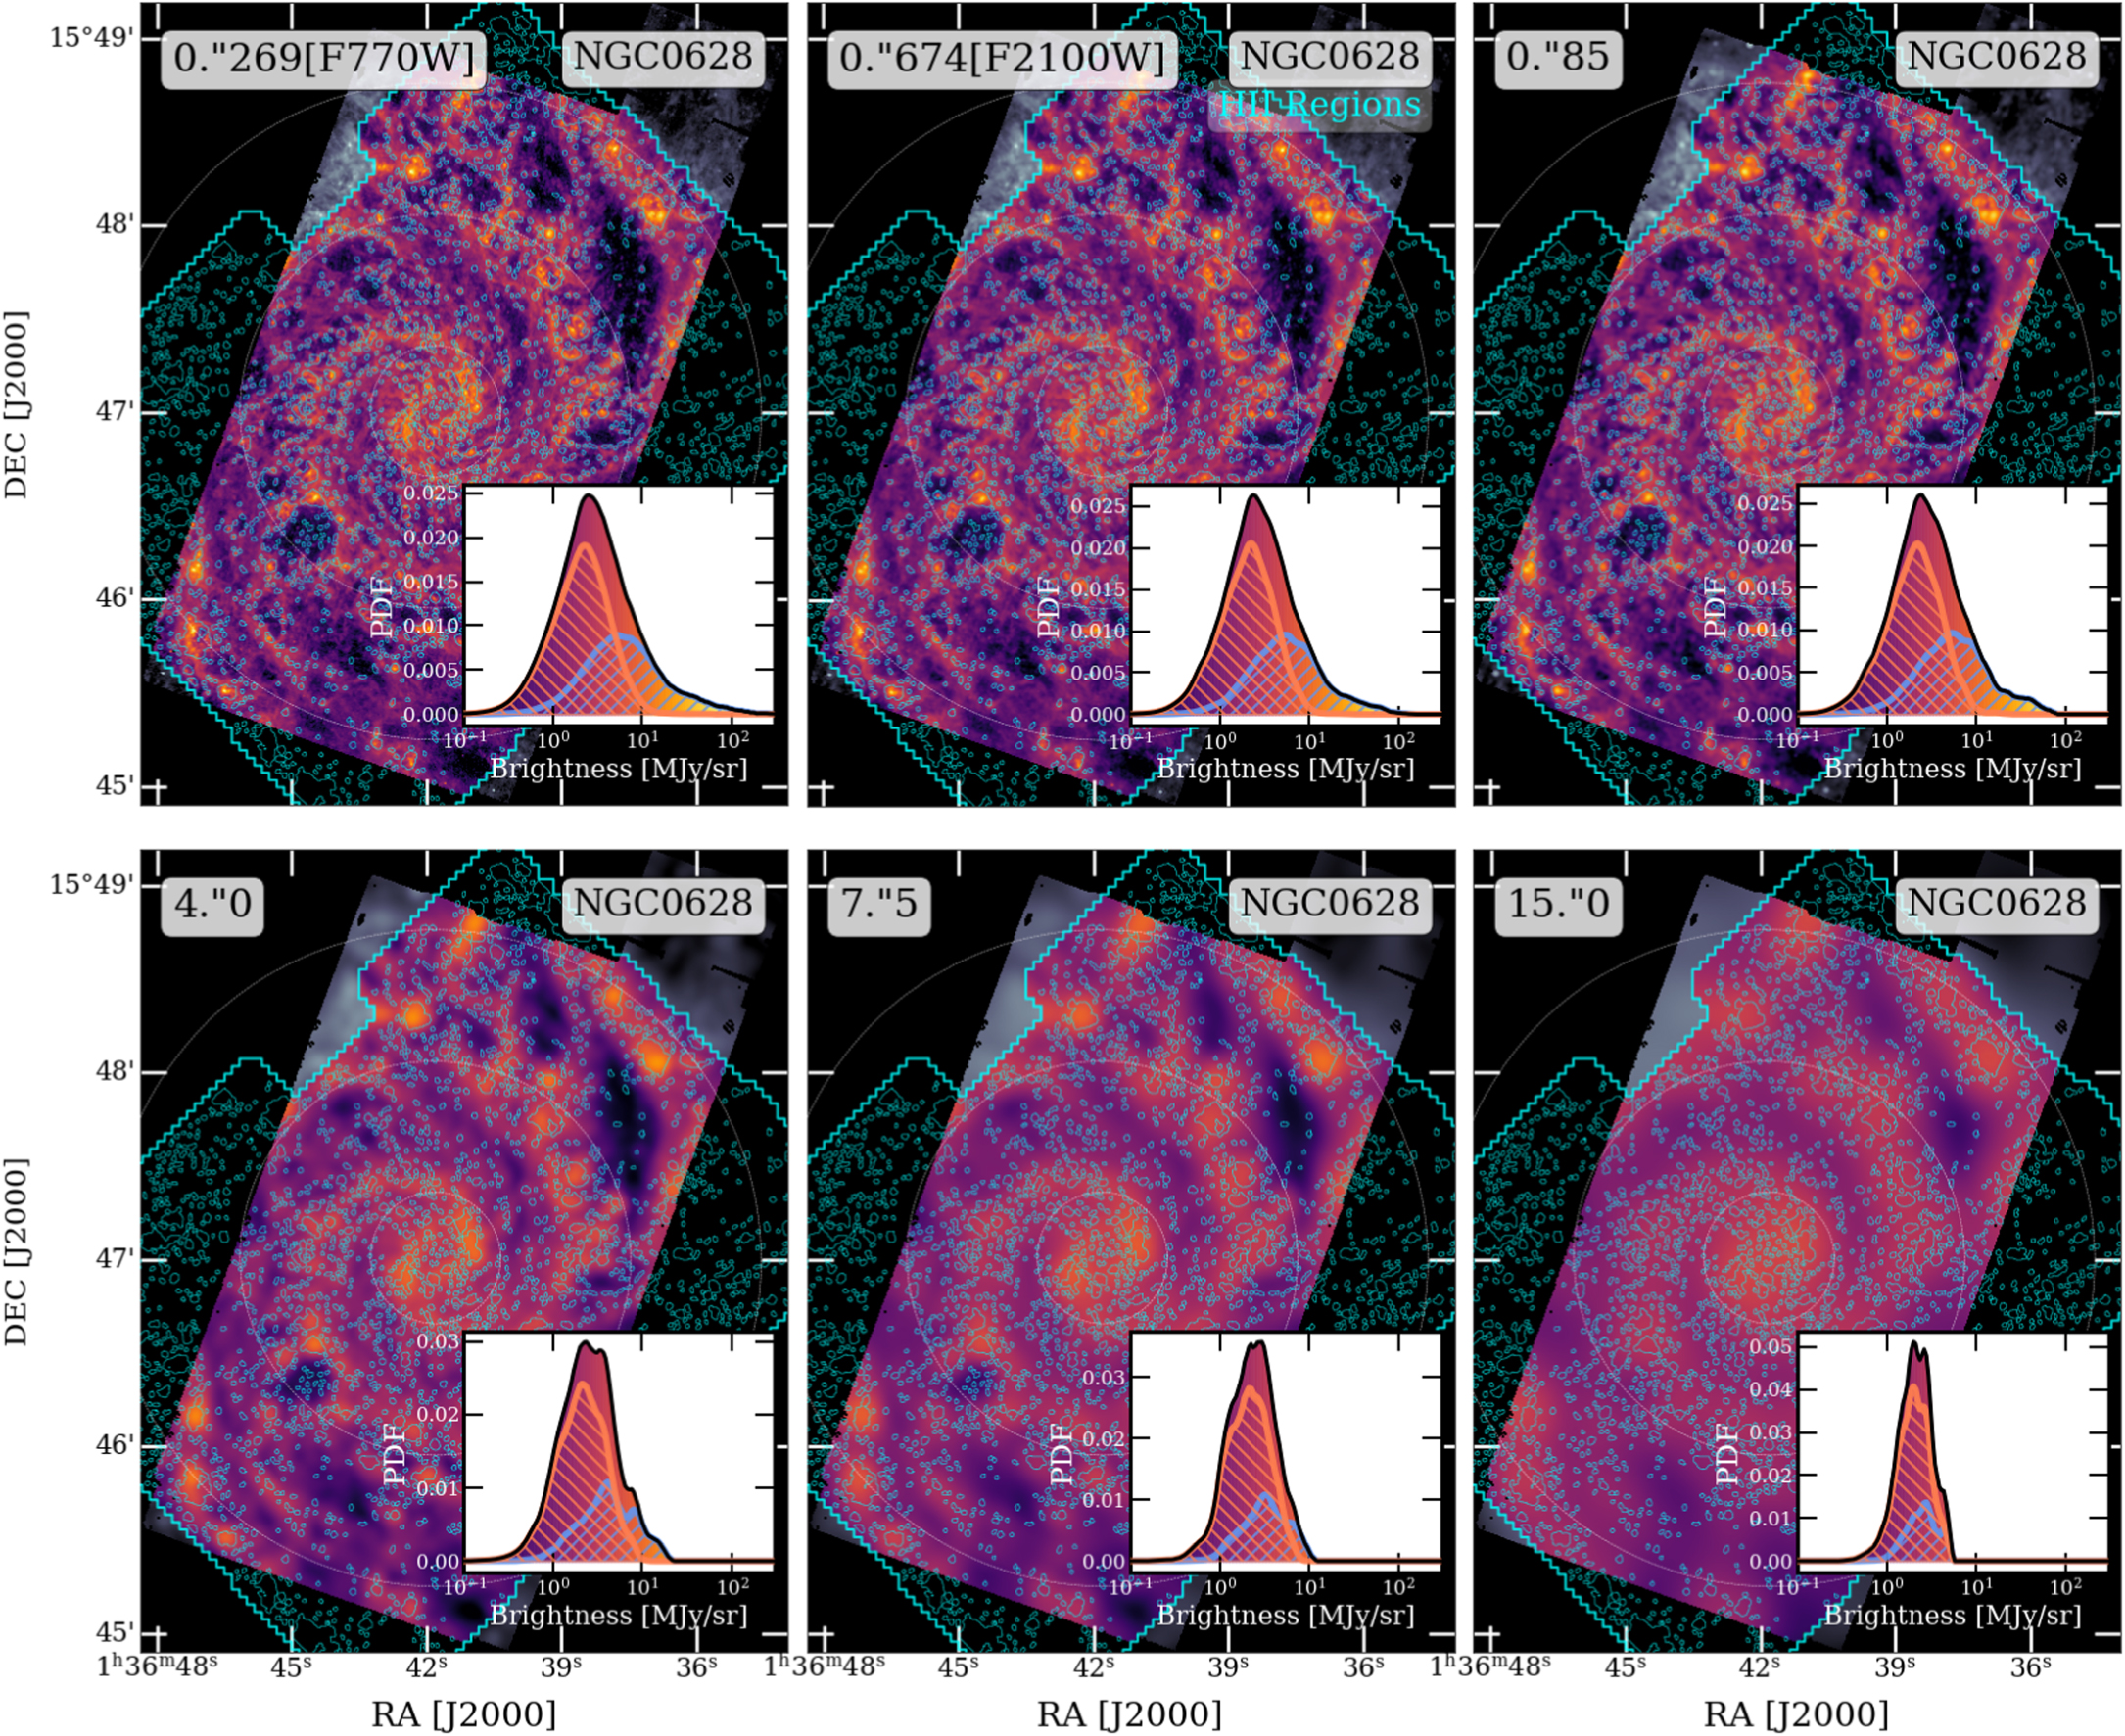
Figure 11. 7.7 μm images and PDFs of the galactic disk of NGC 0628 convolved to progressively lower resolutions—0.″269 (the native resolution of the F770W filter), 0.″674 (the native resolution of the F2100W filter), 0.″85 (our working resolution), 4.″0, 7.″5, and 15.″0. This corresponds to physical resolutions of 12, 32, 40, 190, 356, and 712 pc, respectively, in NGC 0628. The two-component PDF only emerges at high angular resolution when individual star-forming regions can be resolved from the surrounding diffuse emission.
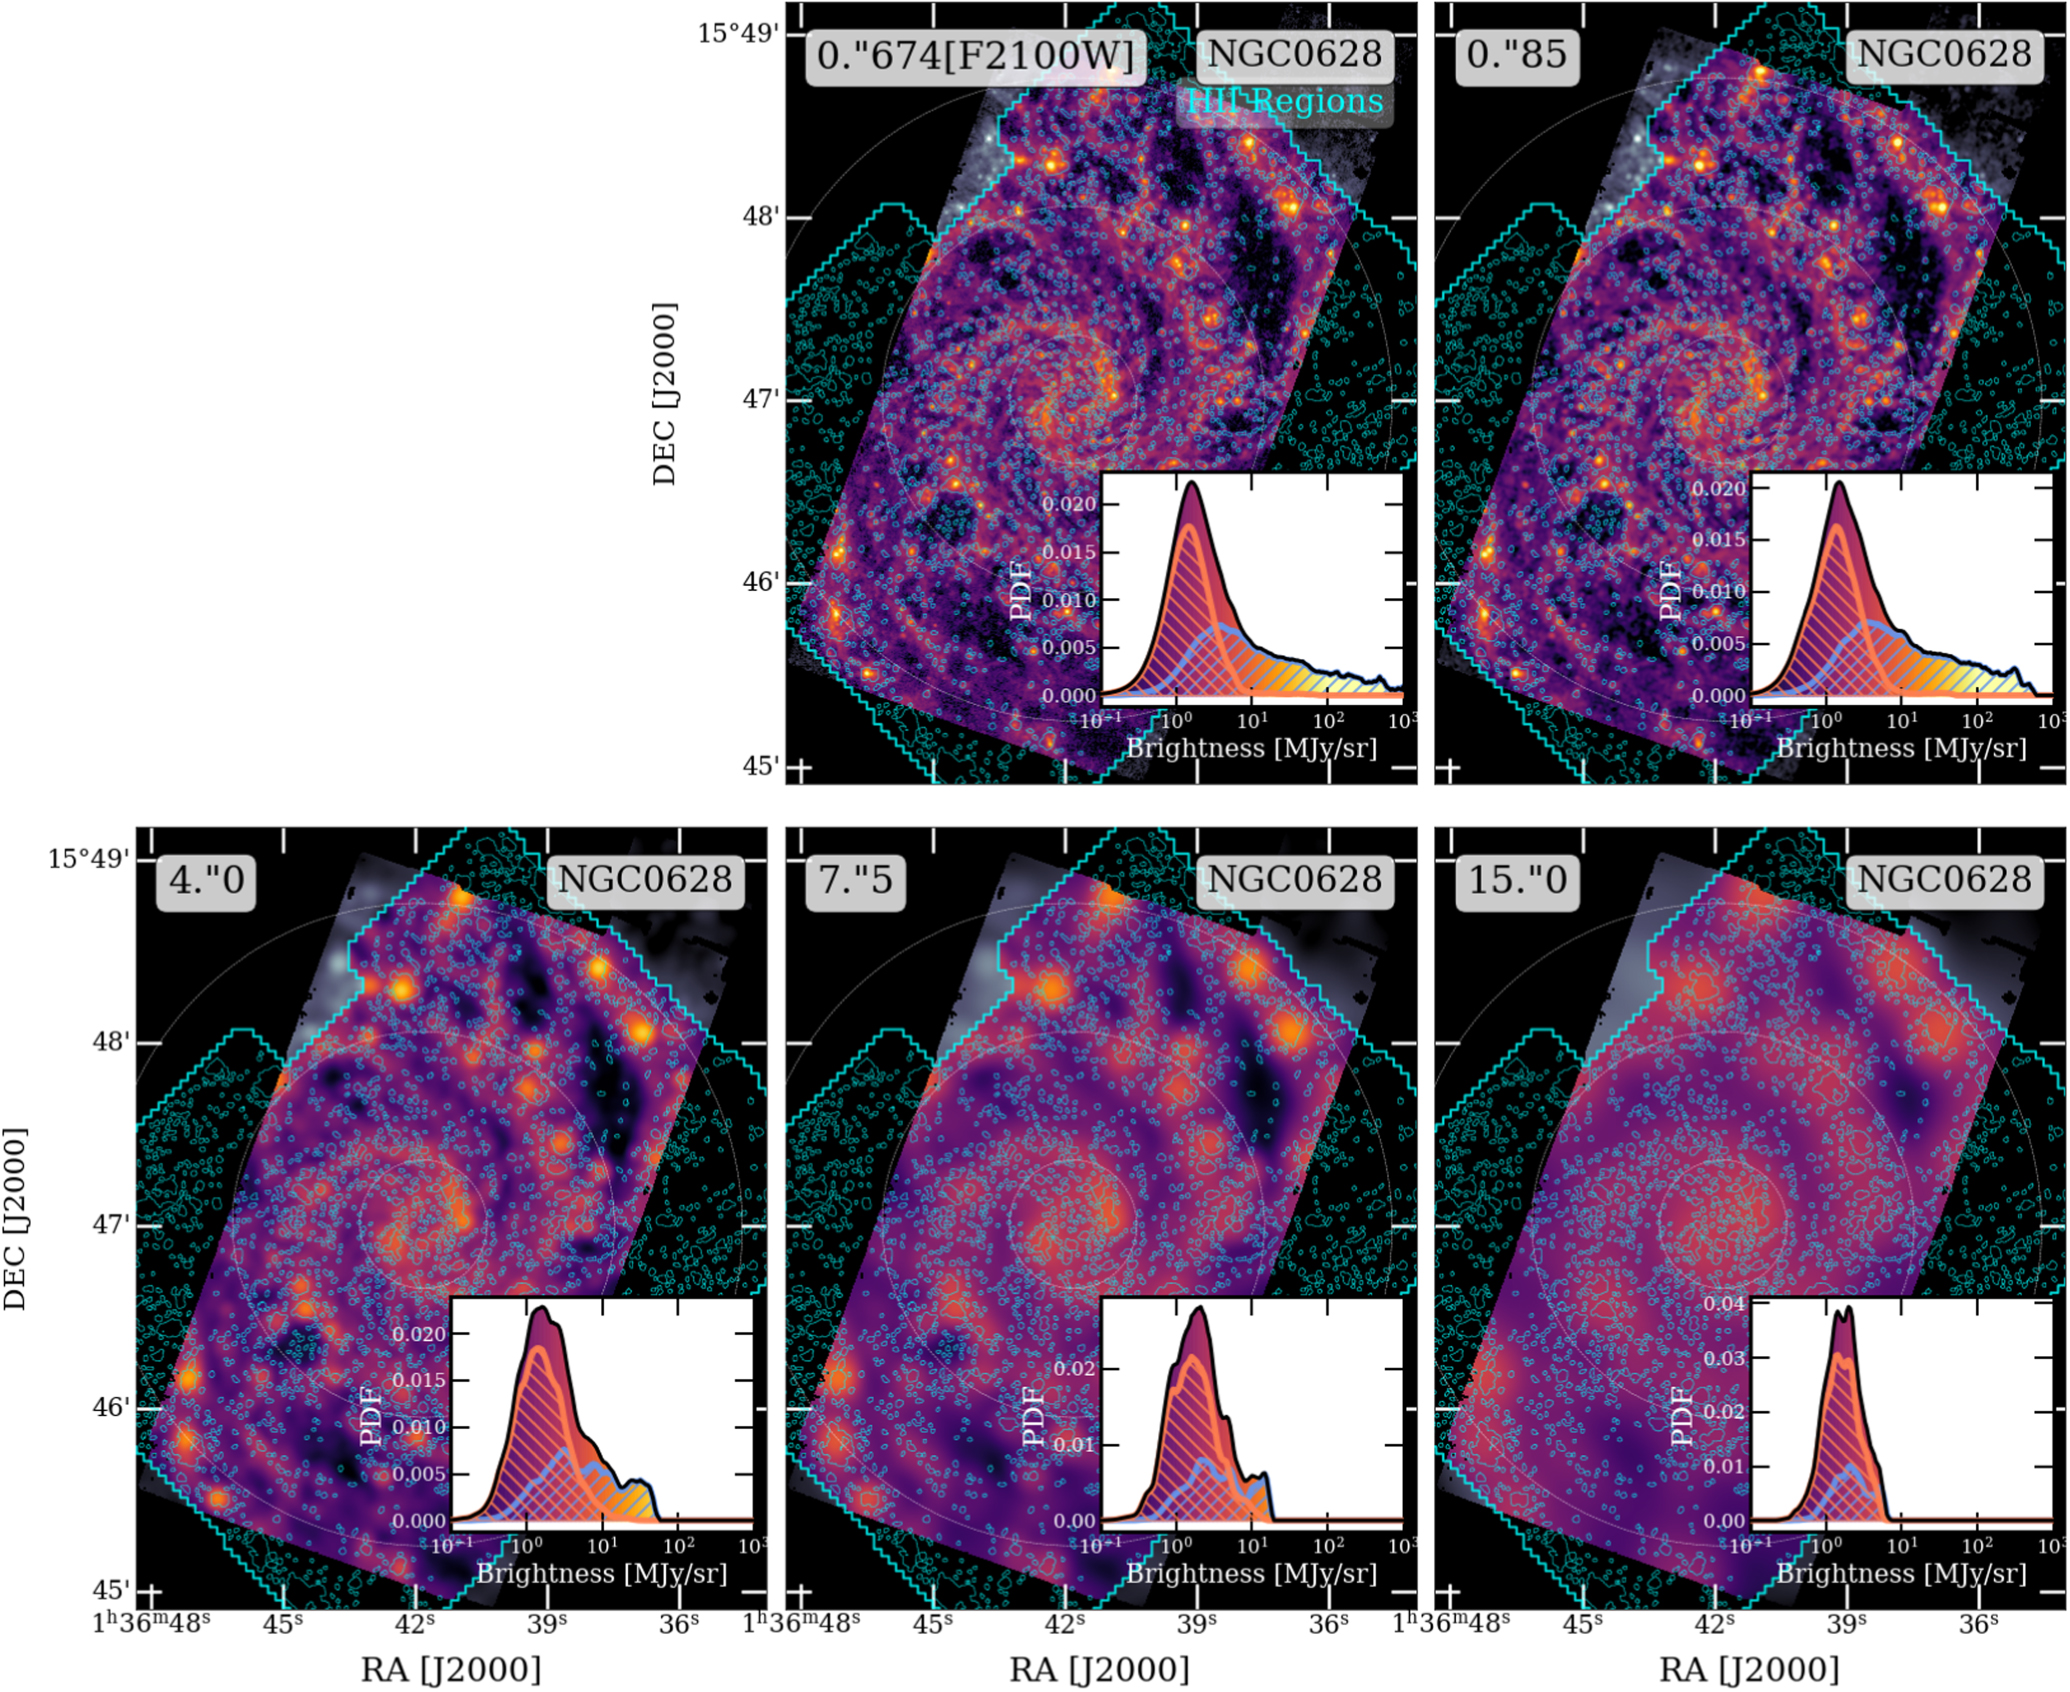
Figure 12. 21 μm images and PDFs of the galactic disk of NGC 0628 convolved to progressively lower resolutions, similar to Figure 11—0.″674 (the native resolution of the F2100W filter), 0.″85 (our working resolution), 4.″0, 7.″5, and 15.″0. This corresponds to physical resolutions of 32, 40, 190, 356, and 712 pc, respectively, in NGC 0628. While the power law is very prominent at high resolution, the power-law component is rapidly diluted at lower resolutions that do not resolve individual star-forming regions in the disk.
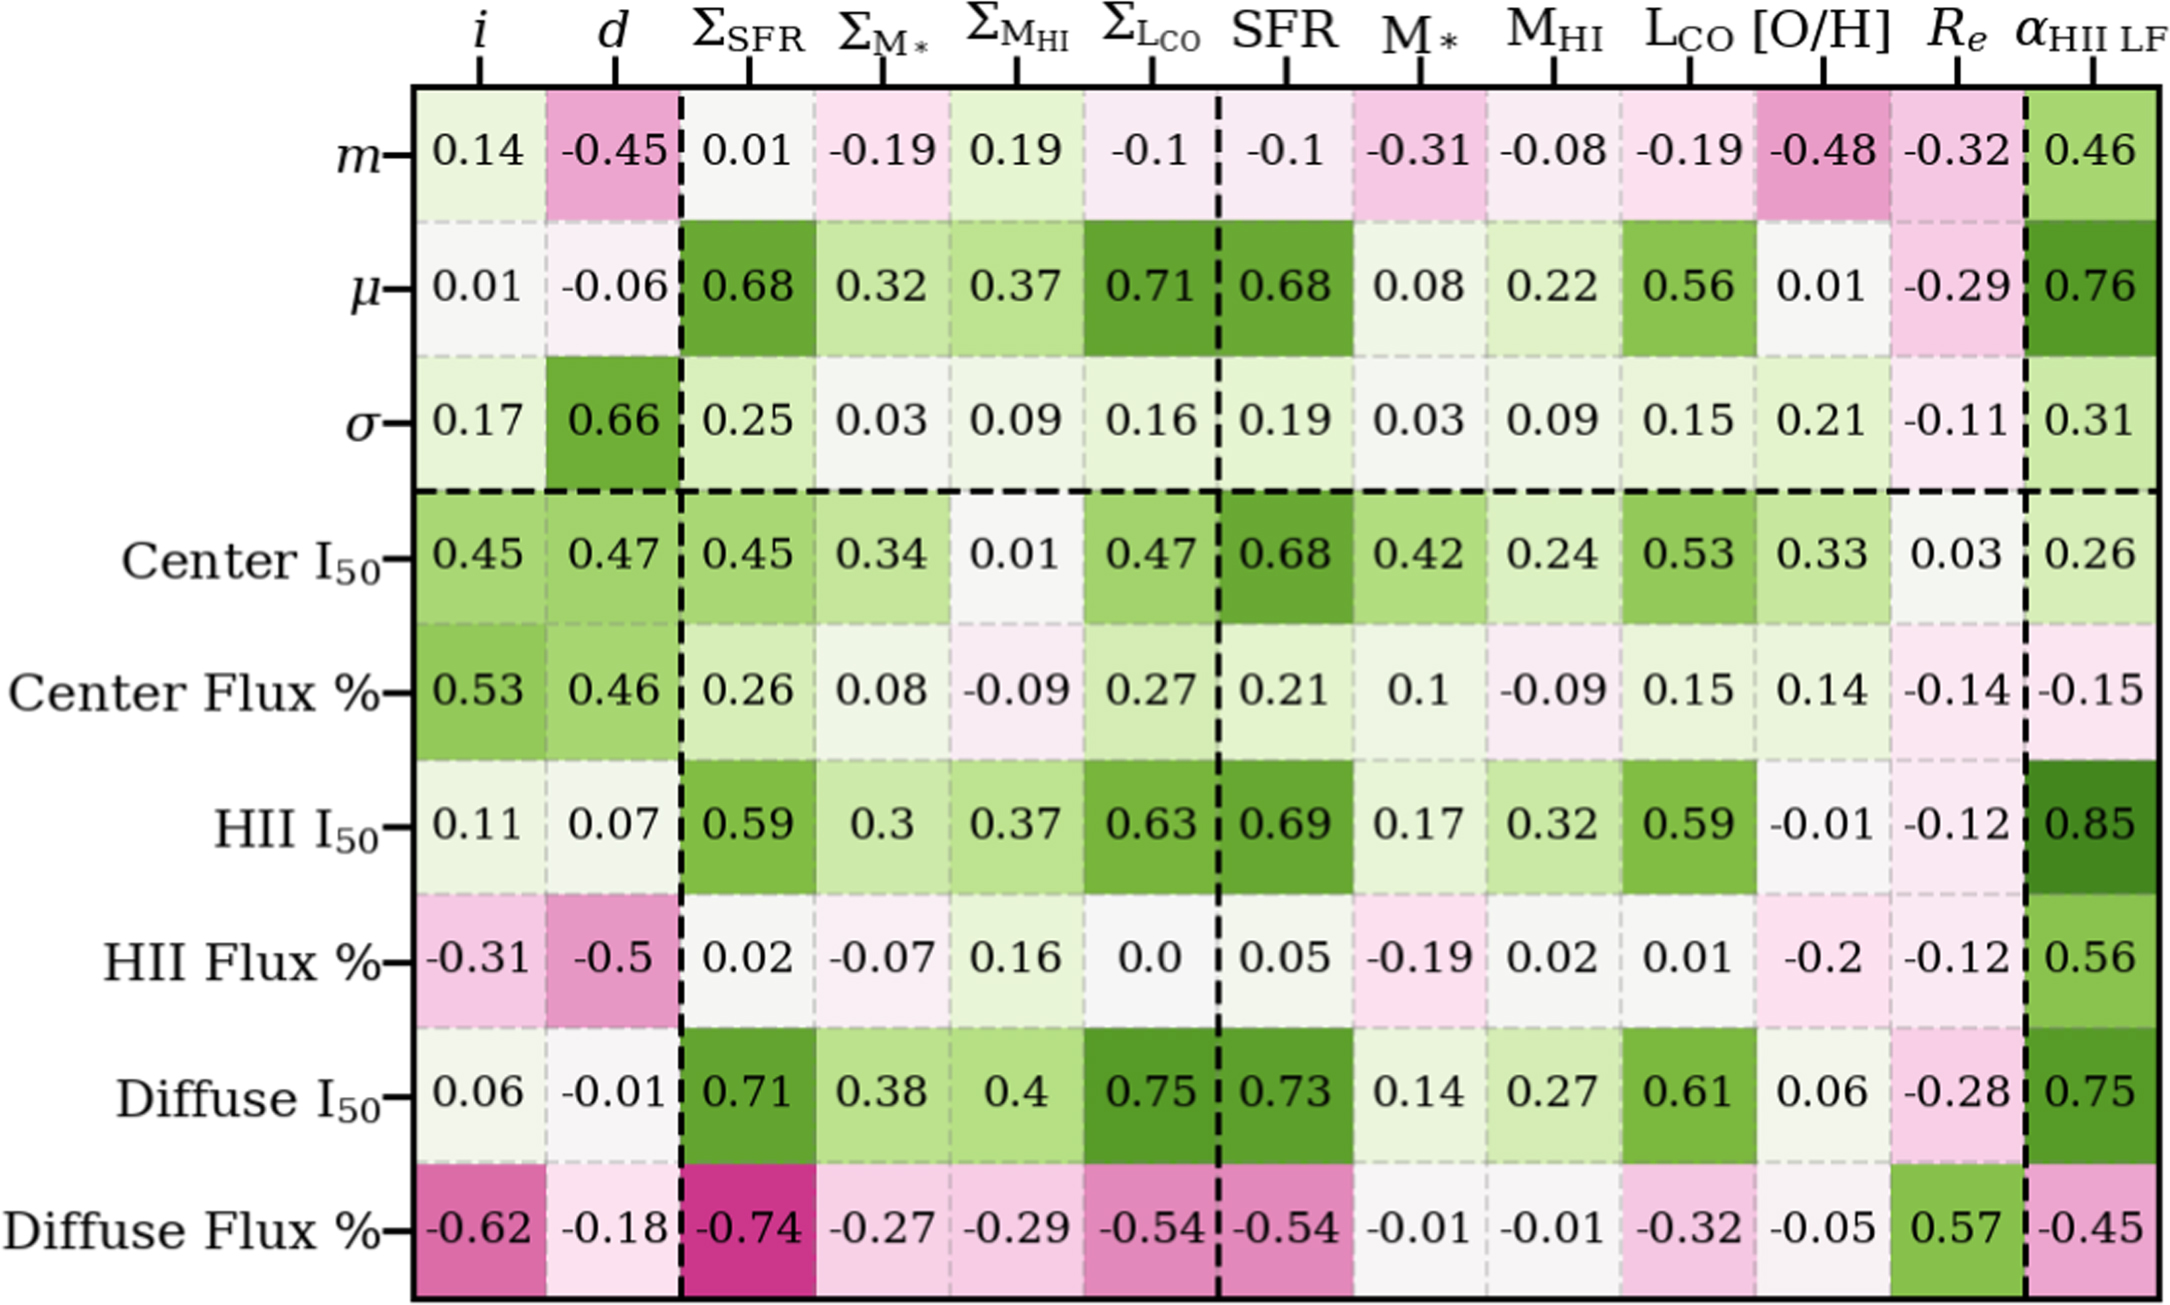
Figure 13. Spearman’s rank correlation coefficients between the parameters of mid-IR PDFs of intensity at 21 μm and global galaxy properties. Stronger positive (negative) correlations are indicated in green (pink). We present rank correlations among the most important observation-specific parameters (galaxy inclination i, distance d), intrinsic properties (SFR surface density ΣSFR, stellar mass surface density ﹩{{\rm{\Sigma }}}_{{M}_{* }}﹩, H I mass surface density ﹩{{\rm{\Sigma }}}_{{M}_{\mathrm{HI}}}﹩, and CO luminosity surface density ﹩{{\rm{\Sigma }}}_{{L}_{\mathrm{CO}}}﹩), and extrinsic properties (average SFR, total stellar mass M *, H I mass M HI, CO luminosity L CO, average [O/H], and effective radius R e ), as well as the H II region luminosity function slopes α from Santoro et al. (2022), with PDF parameters (H II region power-law index m, diffuse lognormal mean μ and dispersion σ) and region-wise flux contributions (median intensity I 50 and percent of total flux in field of view for centers, H II regions, and the diffuse ISM).
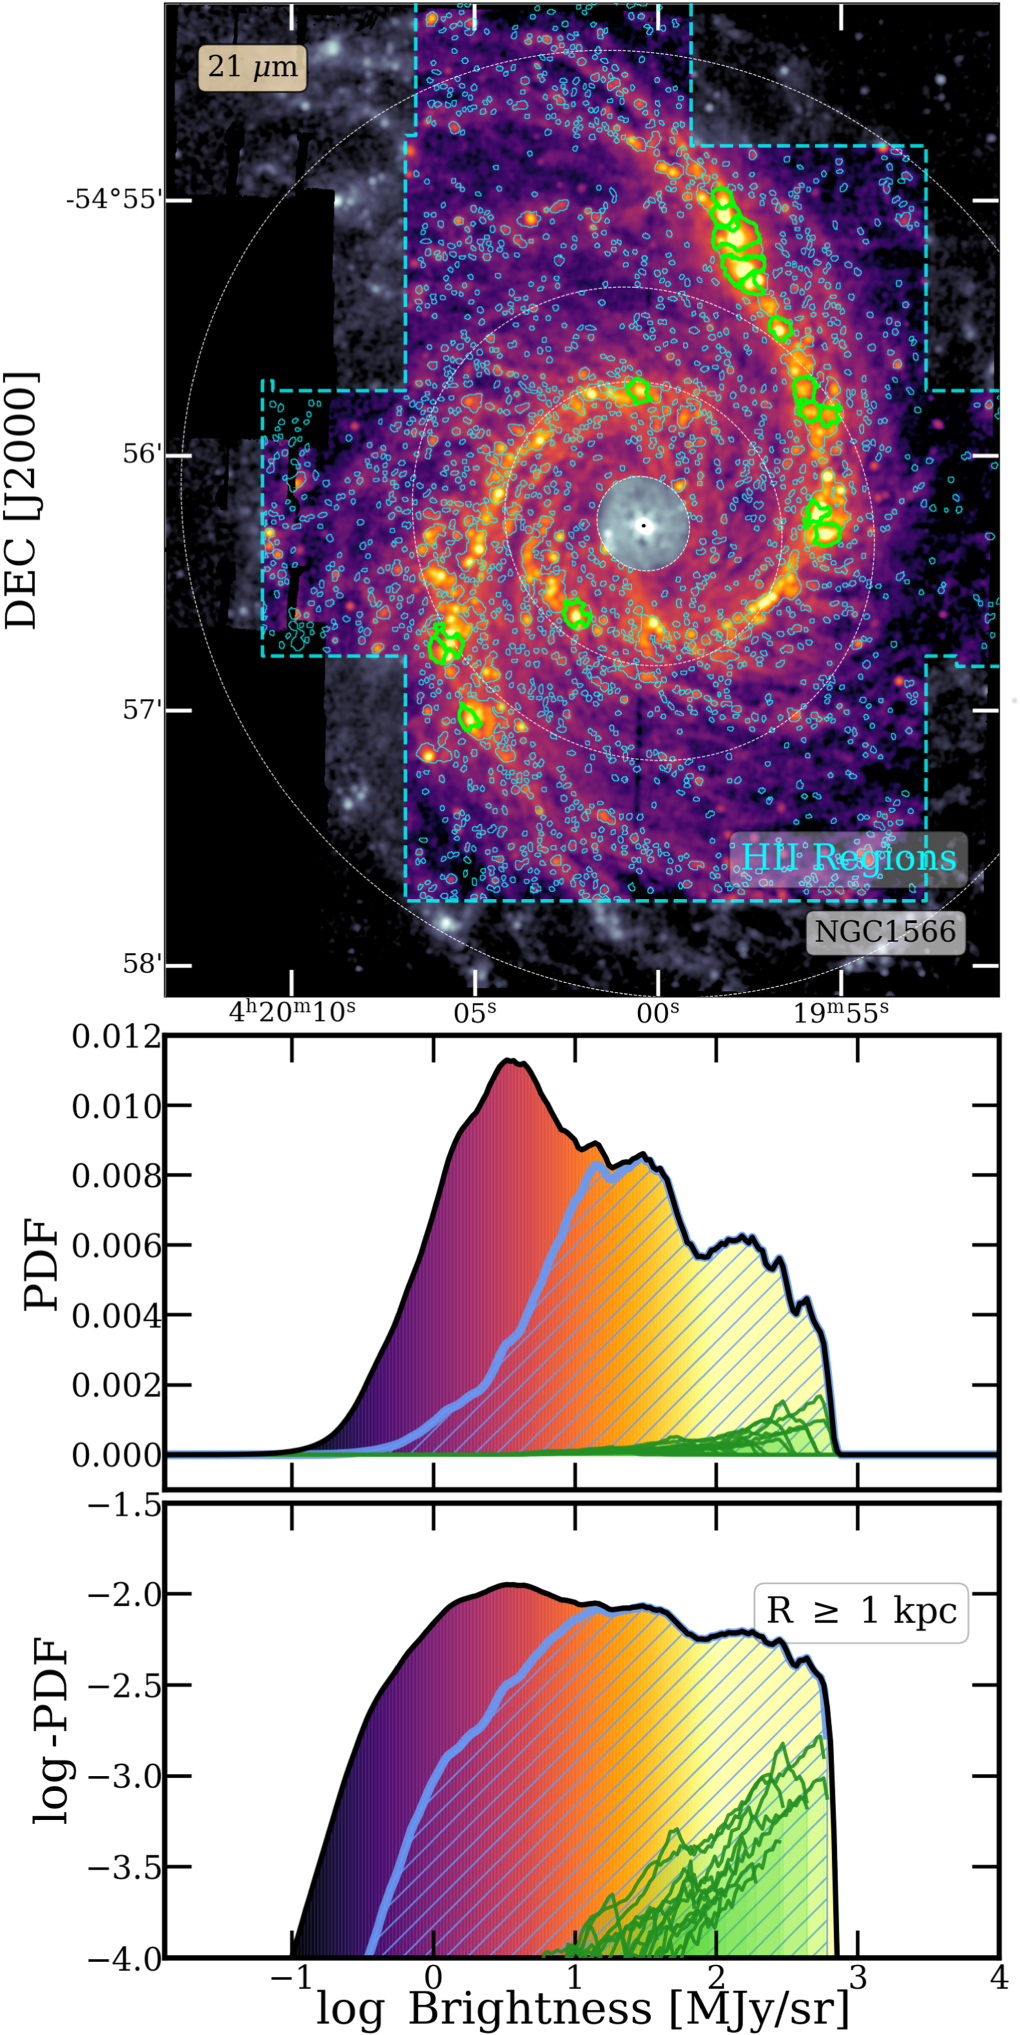
Figure 14. NGC 1566 at 21 μm with all VLT/MUSE-identified H II regions outlined in blue (top), with the corresponding PDF (middle) and log-PDF in intensity (bottom). A few of the largest H II regions in NGC 1566 are highlighted in green. The overall pdf and log-PDF of intensities at 21 μm (black), from all H II regions (blue), and each of the highlighted individual H II regions (green) are shown for comparison.
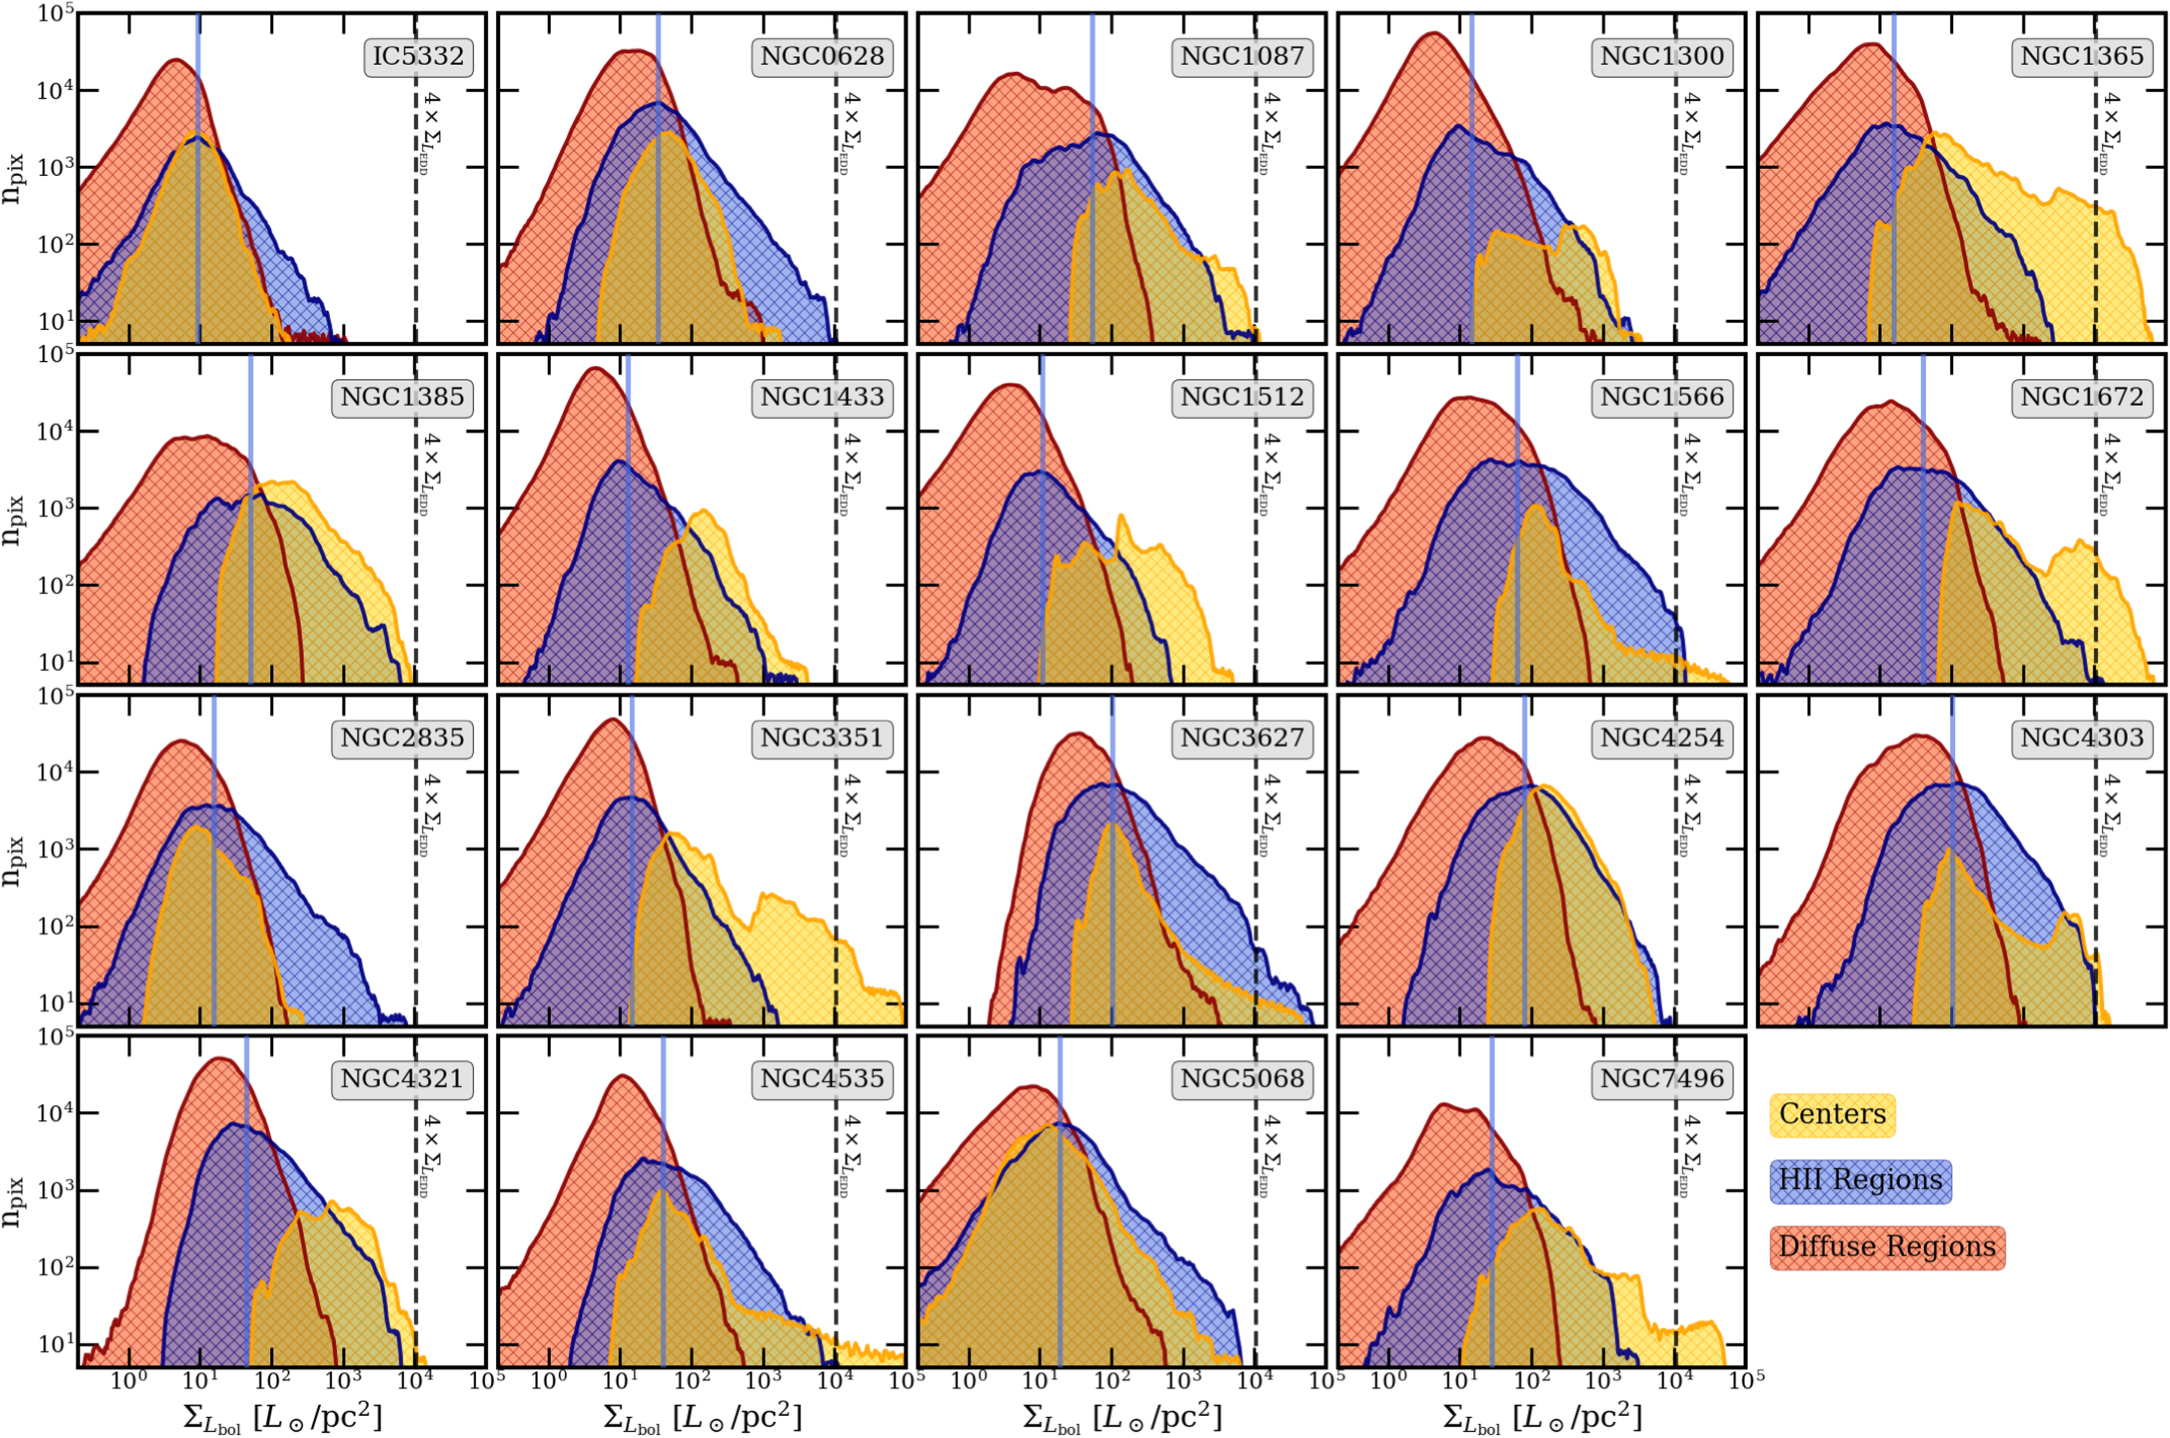
Figure 15. Histograms of pixel-wise bolometric luminosity surface density ﹩{{\rm{\Sigma }}}_{{L}_{\mathrm{bol}}}﹩ from the center (yellow), diffuse component (red), and H II regions (blue) for each of our targets. The median ﹩{{\rm{\Sigma }}}_{{L}_{\mathrm{bol}}}﹩ for H II regions (vertical blue line) remains roughly consistent between targets. The vertical dashed line shows the estimated Eddington luminosity surface density in star-forming regions, scaled from ﹩{{ \mathcal F }}_{{L}_{\mathrm{bol}}}﹩ to ﹩{{\rm{\Sigma }}}_{{L}_{\mathrm{bol}}}﹩ units for direct comparison.
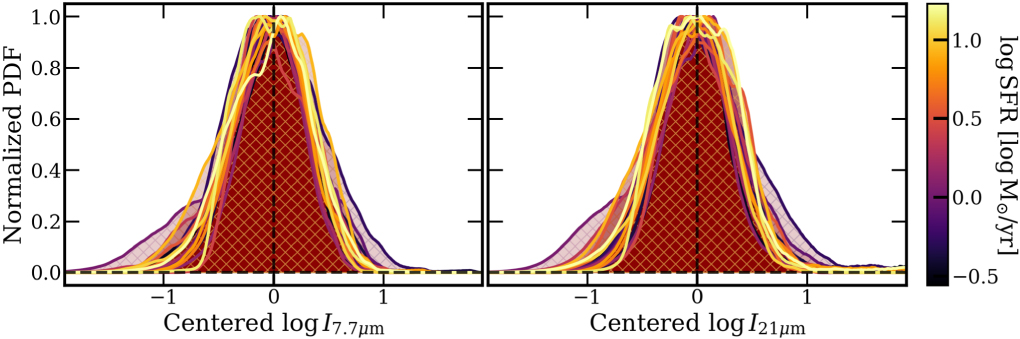
Figure 16. Stacked PDFs of emission from “diffuse” regions normalized by mean intensity and amplitude at 7.7 and 21 μm. The widths of the PDFs remain consistent across targets, with the exception of NGC 1300 with a broad PDF.
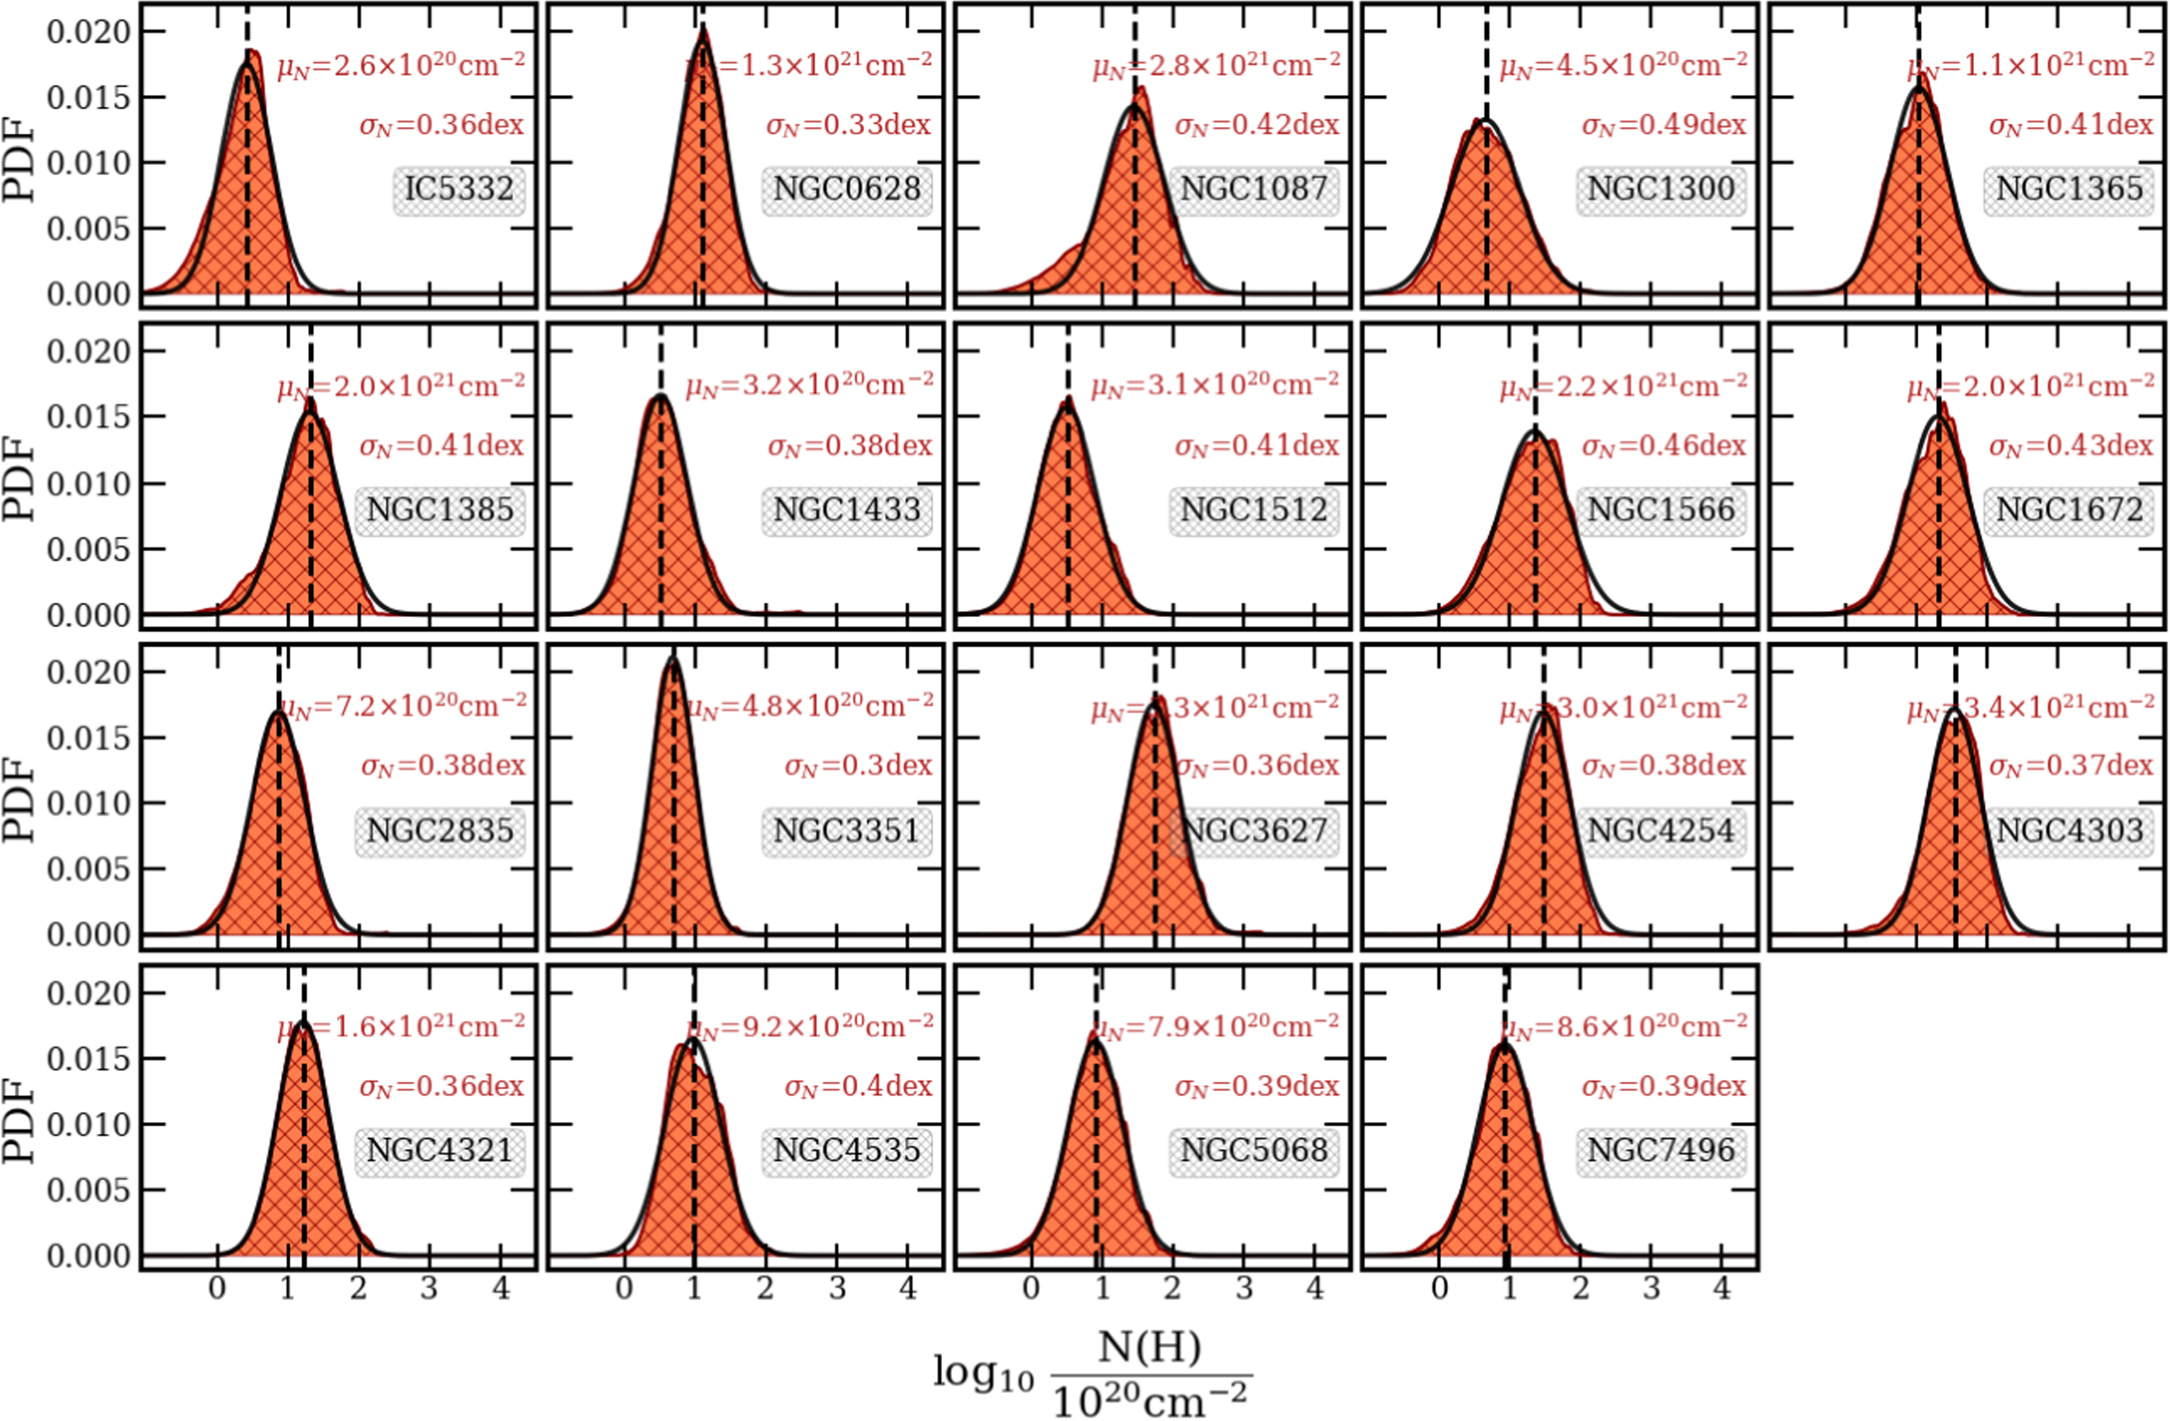
Figure 17. The PDFs of gas column density N(H) in diffuse regions (hatched red) derived from 7.7 μm intensities (Equations (13) and (14)) for each galaxy. Lognormal fits to each of the PDFs with the fit means are overlaid in black for comparison. The best-fit lognormal mean N(H) (μ N ) and dispersion (σ N ) are included, as in Table 2.
Figure 18. The complete figure set (19 images) is available in the online journal.
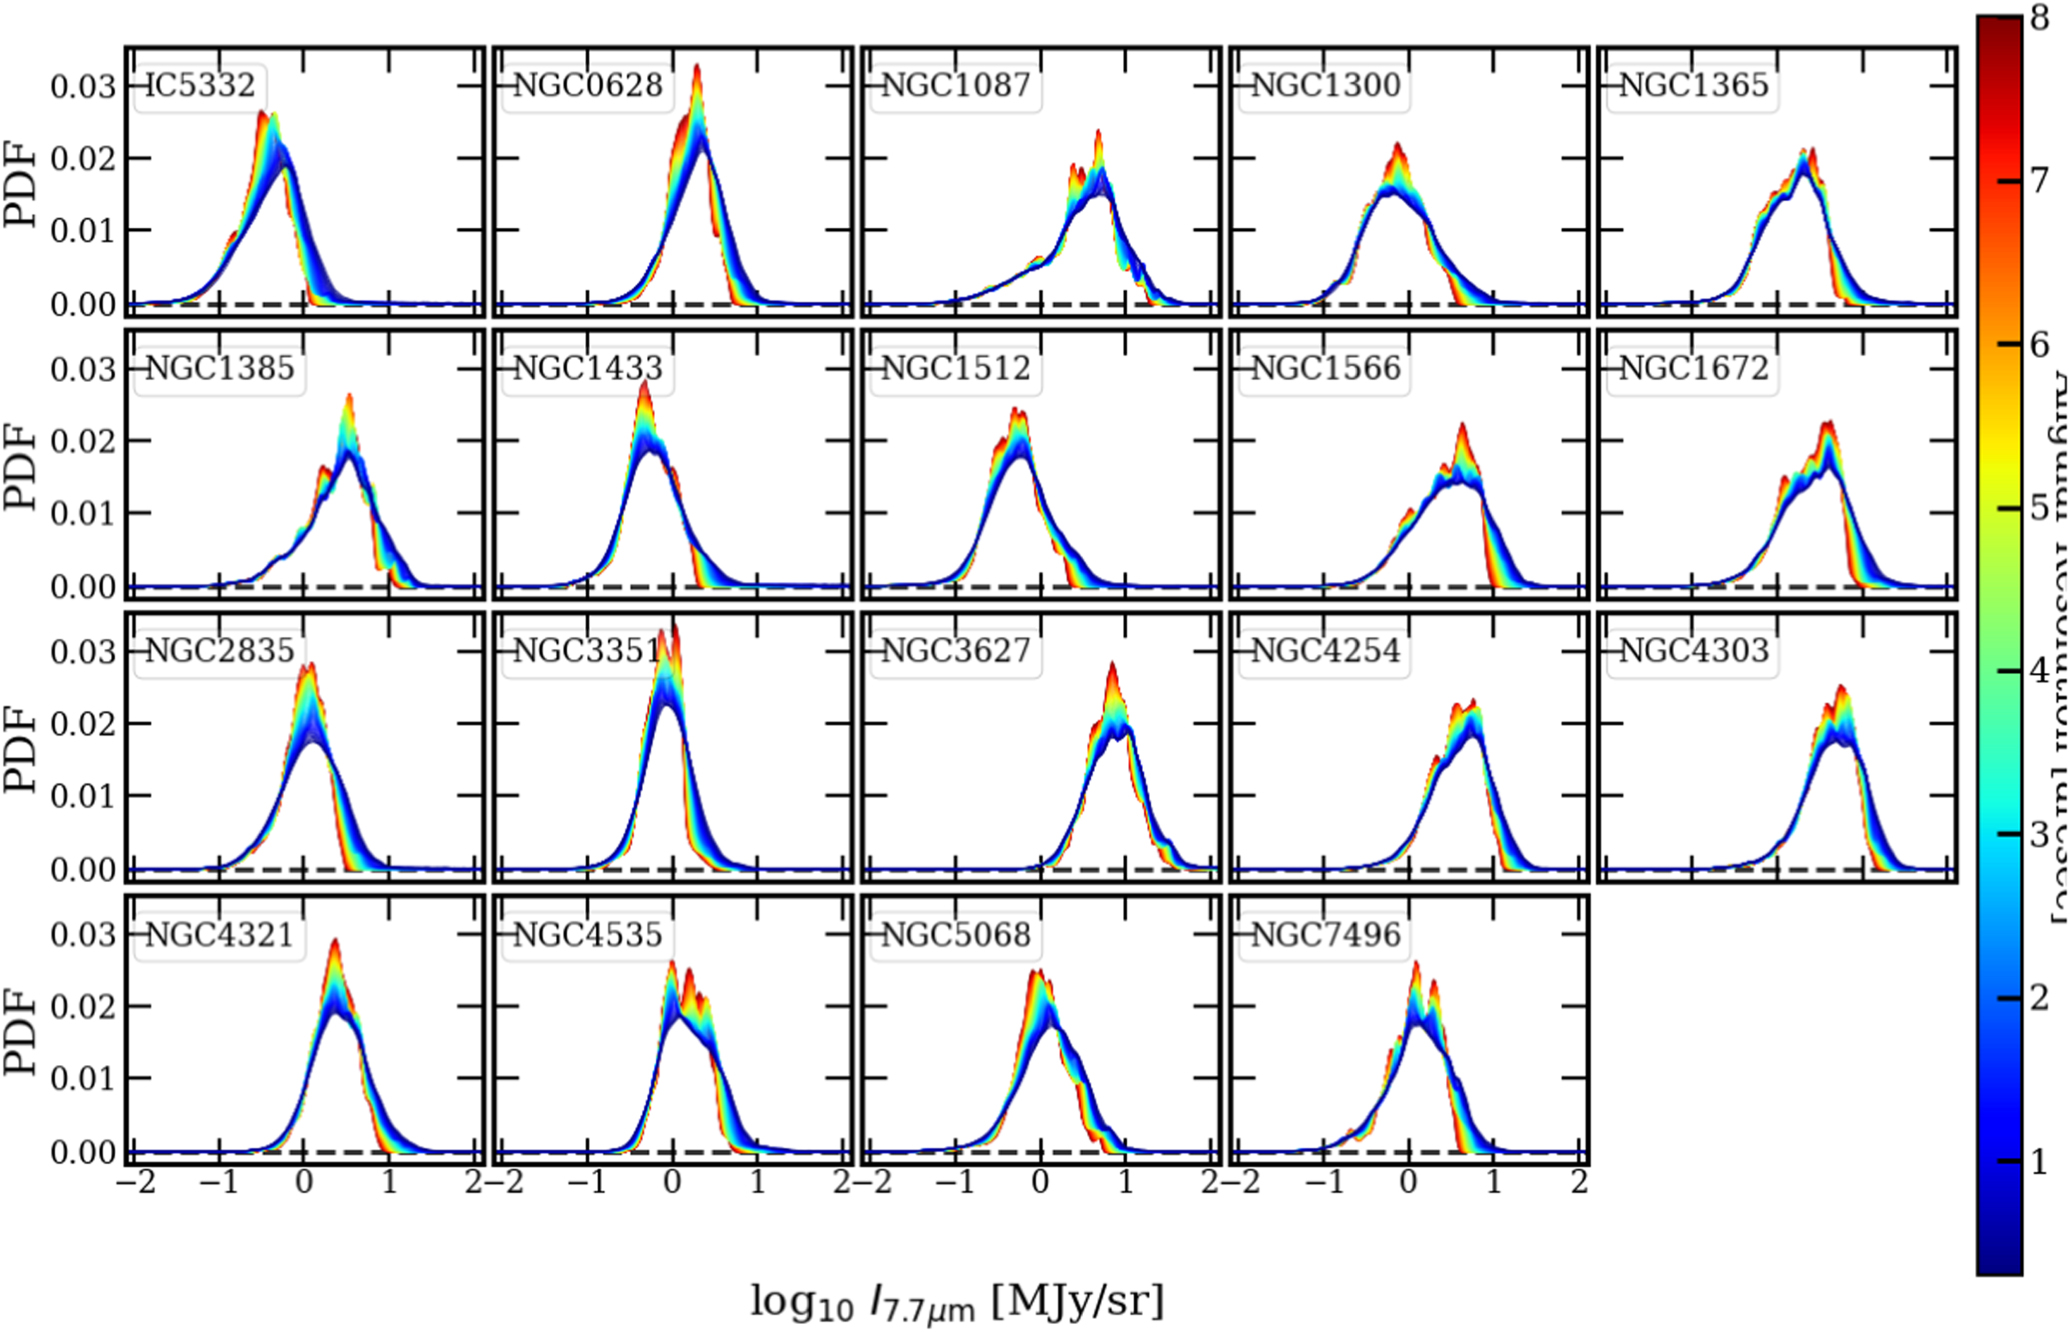
Figure 19. The PDFs of I F770W across different resolutions from native F770W (0.″269) down to 8.″0 for each target. The PDFs are colored by the FWHM of the Gaussian PSF at each resolution. With lower resolution, the overall PDFs become narrower and shift to lower intensities.
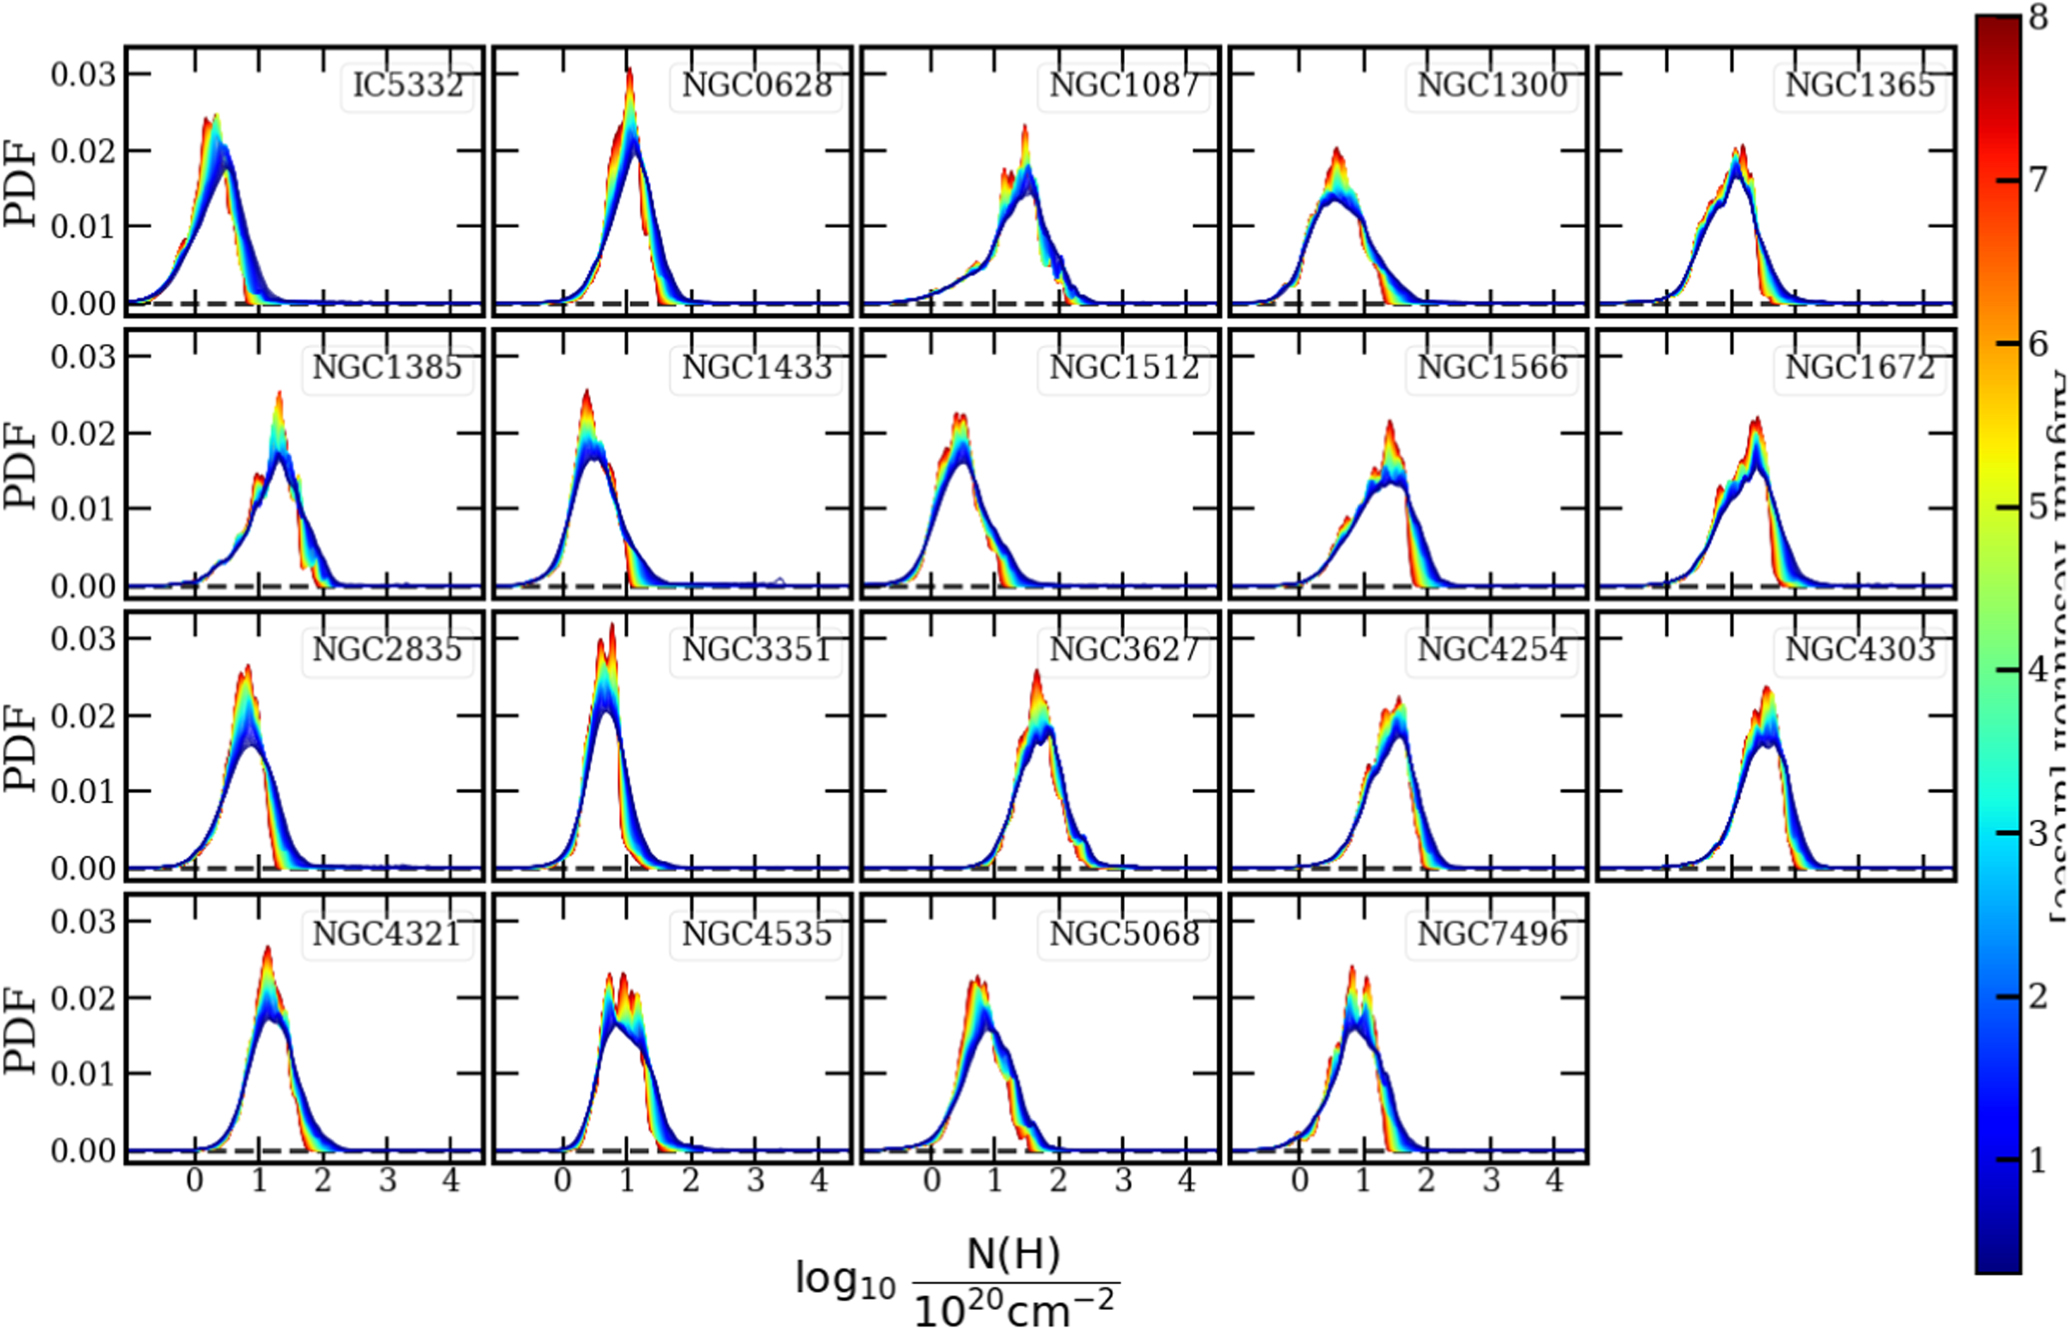
Figure 20. The PDFs of N(H) across different resolutions from native F770W (0.″269) down to 8.″0 for each target. The PDFs are colored by the FWHM of the Gaussian PSF at each resolution. With lower resolution, the overall PDFs become narrower and shift to lower column densities.
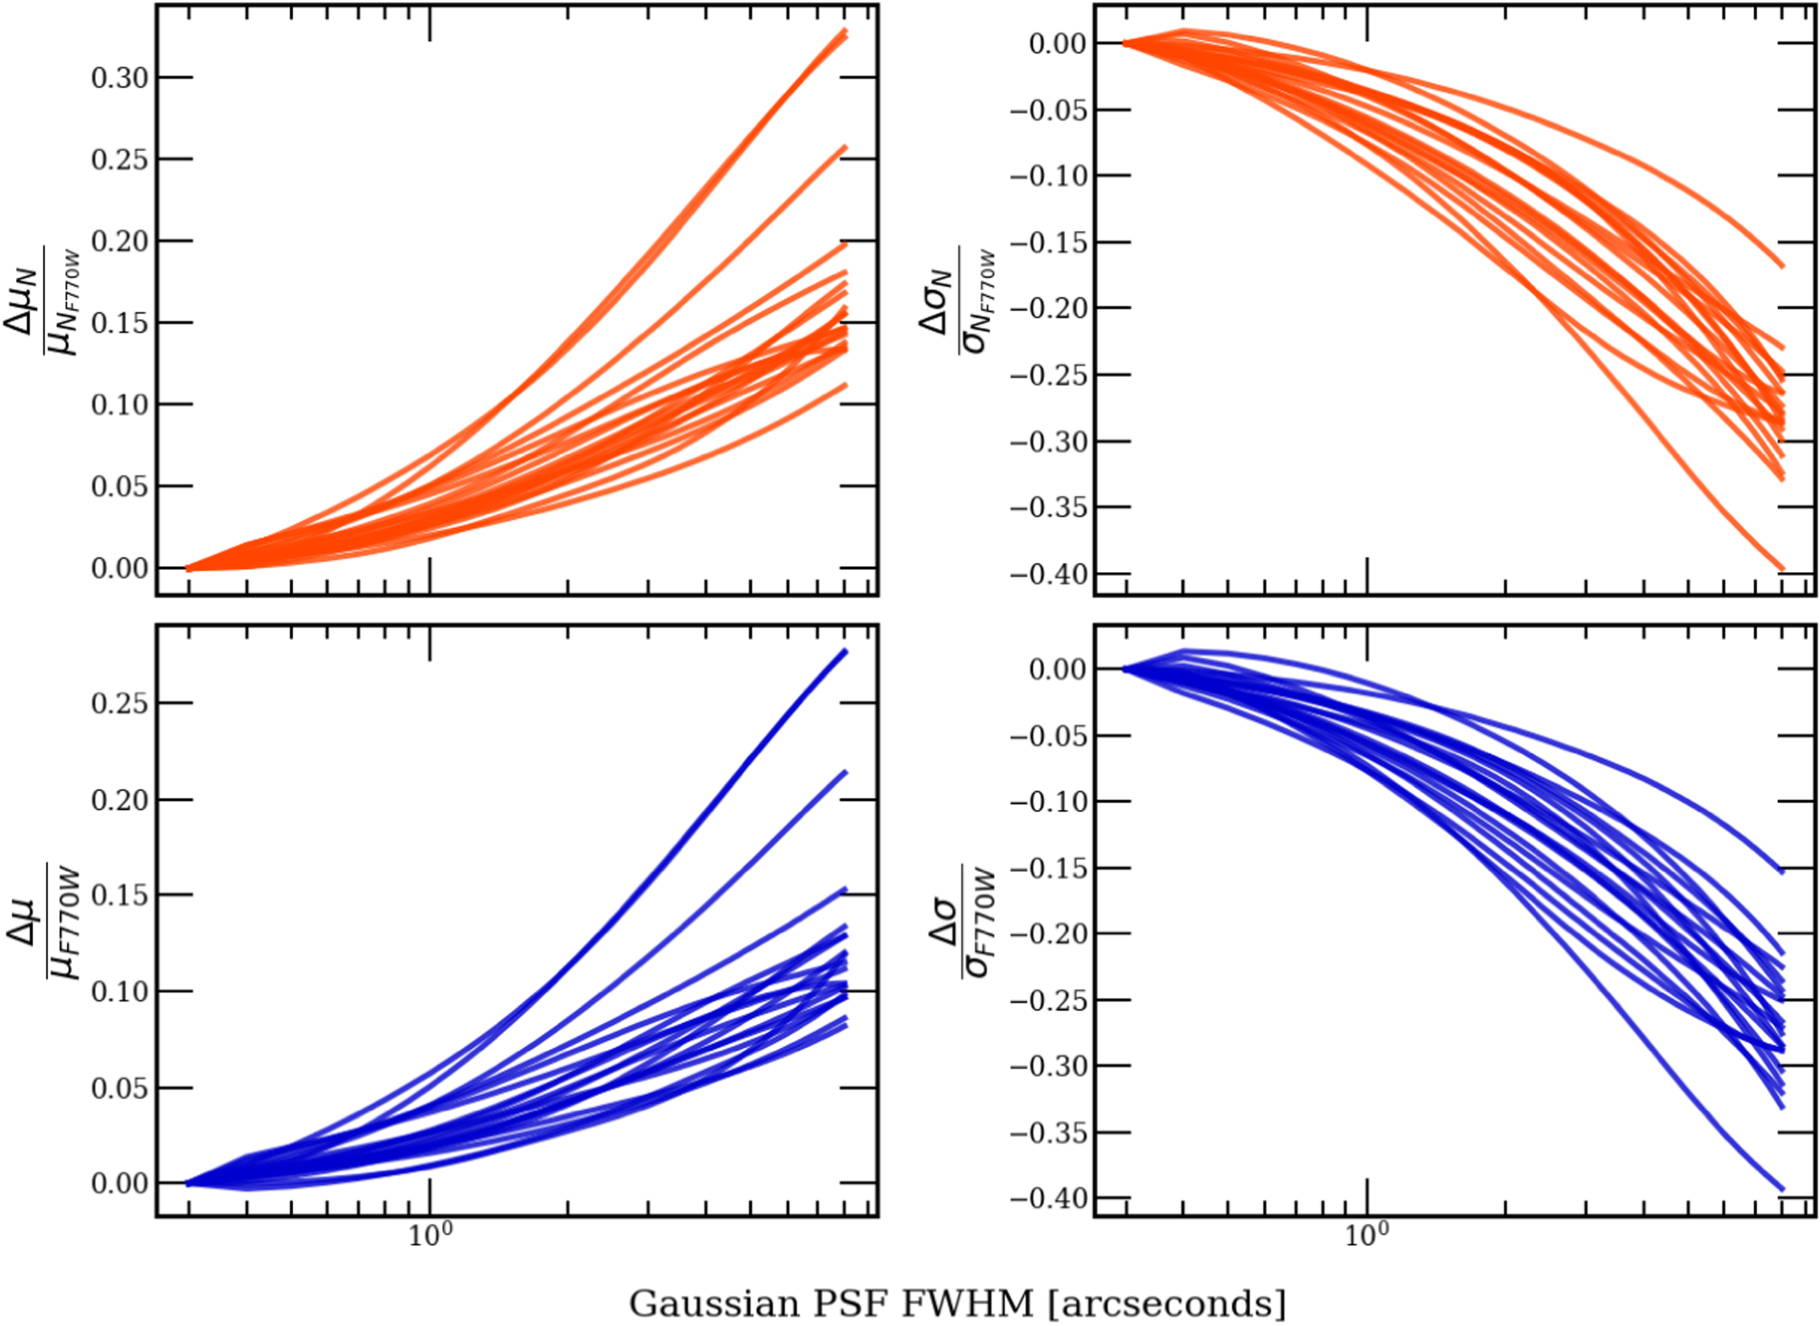
Figure 21. Summarizing the fractional variation in diffuse column density PDF mean (μ N ) and dispersion (σ N ) and in diffuse F770W emission PDF mean (μ) and dispersion (σ).