Survivors and Zombies: The Quenching and Disruption of Satellites Around Milky Way Analogs

Published in The Astrophysical Journal, Volume 989, Issue 2, id.178, 18 pp., 2025

Abstract

It is necessary to understand the full accretion history of the Milky Way in order to contextualize the properties of observed Milky Way satellite galaxies and the stellar halo. This paper compares the dynamical properties and star formation histories of surviving and disrupted satellites around Milky Way─like galaxies using the D.C. JUSTICE LEAGUE suite of very high-resolution cosmological zoom-in simulations of Milky Way analogs and their halo environments. We analyze the full census of galaxies accreted within the past 12 Gyr, including both surviving satellites at z = 0, and dwarf galaxies that disrupted and merged with the host prior to z = 0. Our simulations successfully reproduce the trends in M*−[Fe/H]−[α/Fe] observed in surviving Milky Way satellites and disrupted stellar streams, indicating earlier star formation for disrupted progenitors. We find the likelihood and timescales for quenching and disruption are strongly correlated with the mass and time of infall. In particular, none of the galaxies accreted more than 12 Gyr ago survived, and only 20% of all accreted galaxies with M* > 108 M⊙ survive. Additionally, satellites with highly radial trajectories are more likely to quench and disrupt. Disruption proceeds quickly for ≥106 M⊙satellites accreted 10─12 Gyr ago, often on timescales similar to the ∼300 Myr snapshot spacing. For high-mass satellites, the disruption timescale is faster than the quenching timescale. As a result, 92% of disrupted galaxies remain star forming up until disruption. In contrast, ultrafaint dwarfs (UFDs) tend to quench prior to accretion, and 94% of UFDs accreted up to 12 Gyr ago survive at z = 0.

Figures
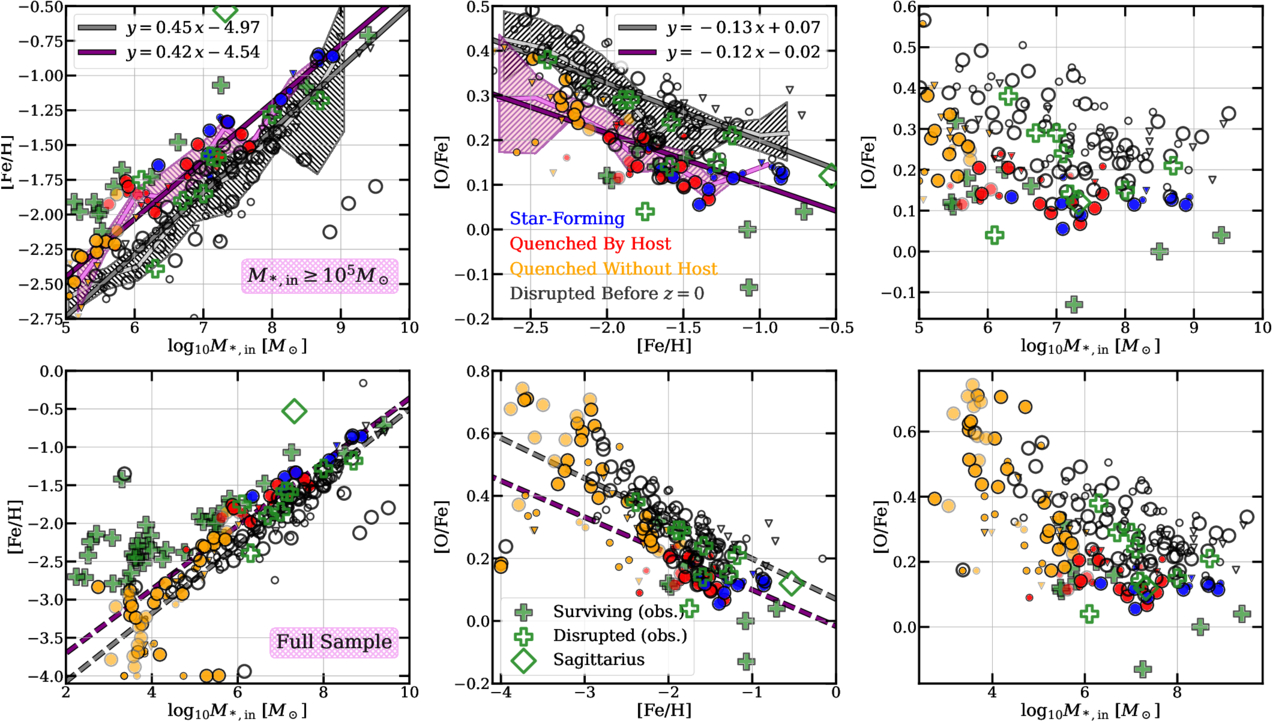
Figure 1. Top: the stellar mass–Z–α relation for simulated satellites in the intermediate- to high-mass range (M*,in ≥ 105 M⊙) where satellites are colored by quenching and survival status. Disrupted satellites are shown in gray open symbols. Surviving star-forming satellites are shown in filled blue symbols, satellites quenched by the host are in red, and satellites quenched >1 Gyr prior to infall are in orange. Surviving galaxies that have fewer than 95% of their infall stars and thus likely to be in the process of tidal disruption are marked by transparent colored markers. Mint resolution satellites, Near Mint Sandra and Elena, and Near Mint Ruth and Sonia satellites are shown in large circles, small circles, and small triangles, respectively. Observed satellites are included in green, where stellar masses from surviving satellites are derived from J. D. Simon (2019) using a mass-to-light ratio of one and MV,⊙ = 4.8, and the [Fe/H] values are also from J. D. Simon (2019). Disrupted satellites (green open pluses) and Sagittarius (green open diamond) are compiled from R. P. Naidu et al. (2022). All [O/Fe] values from the observations are set to the [α/Fe] values from R. P. Naidu et al. (2022). For all surviving and disrupted satellites ≥105 M⊙, we provide the binned medians (light pink and gray lines, respectively), 16th–84th percentile range (pink and gray hatches), and the corresponding least squares fit to the binned medians (dark purple and gray lines). Bottom: similar to the top row, but for our full sample of satellites including observed ultrafaint dwarfs (UFDs). Our simulations appear consistent with the overall M–Z–α trend for satellites around the Milky Way, and successfully reproduce the relatively metal-poor but α-enhanced population of disrupted satellites. The same best-fit lines for satellites ≥105 M⊙ are replotted for comparison.
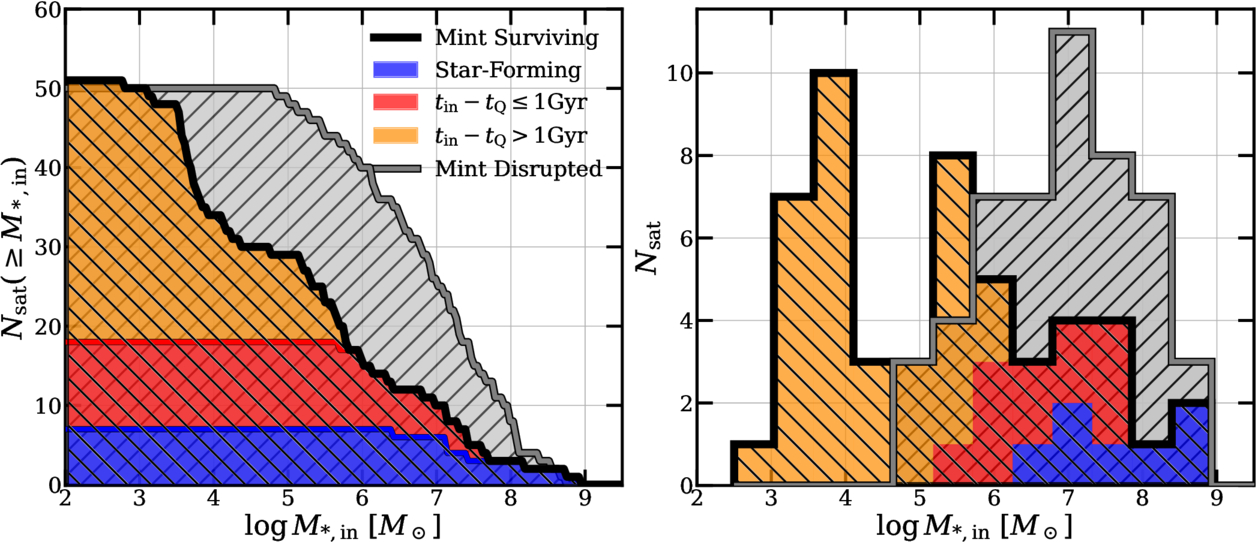
Figure 2. Left: CDF of infall stellar masses M*,in of the Mint resolution sample. Using a similar coloring scheme as in Figure 1, the CDF of disrupted satellites is indicated in gray, while the contribution to surviving satellites from star-forming satellites, satellites quenched by the host, and satellites quenched >1 Gyr prior to infall are indicated in blue, red, and orange, respectively. The stacked CDFs of these three categories (indicated by the thick black line) make up the total surviving satellite population. Right: stacked histograms showing the distribution of M*,in between surviving and disrupted satellites. We separate the surviving satellites by quenching status, as in the left panel.
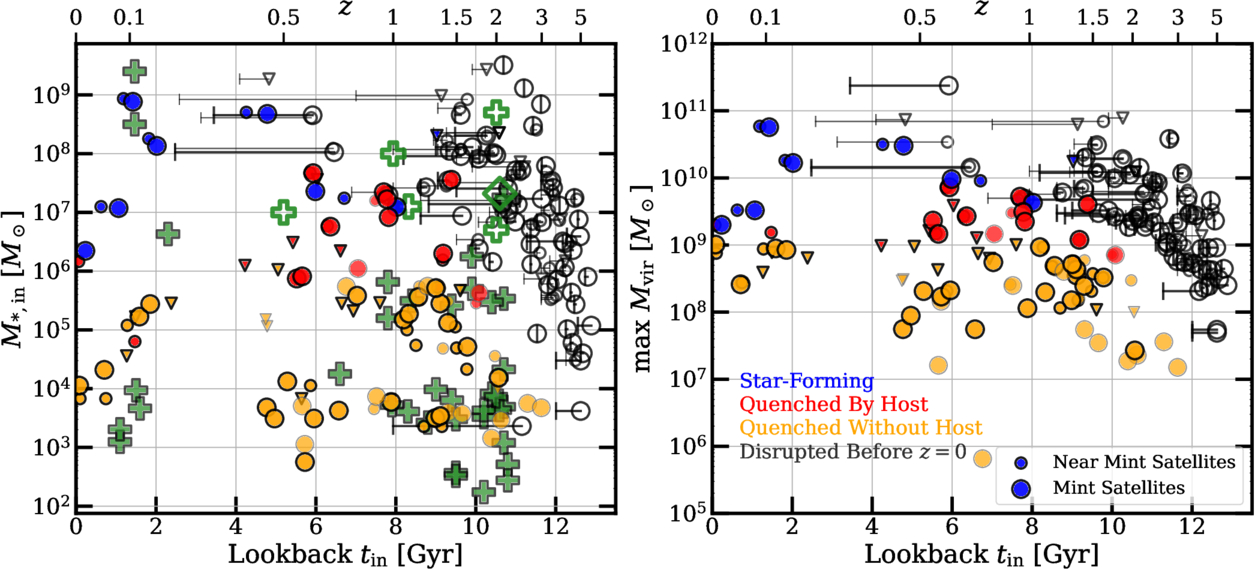
Figure 3. Left: stellar masses at infall (M*,in) and the lookback time to infall for our full sample, using the same color scheme as Figure 1. Horizontal bars extending out to the time of disruption are shown for each disrupted satellite (open symbols). As in Figure 1, observations are indicated by pluses, Mint resolution simulated satellites are indicated by large circles, and satellites from the Near Mint (lower-resolution) runs are indicated by smaller symbols (Sandra and Elena in circles, Ruth and Sonia in triangles). Observed surviving satellites, shown as filled green pluses, have stellar masses derived from J. D. Simon (2019) as in Figure 1, and infall times from S. P. Fillingham et al. (2019). Data for disrupted galaxies (shown as empty green pluses) are from R. P. Naidu et al. (2022). Surviving satellites that retain <95% of the stars they accreted with at z = 0 are indicated in lower-opacity symbols. Right: similar to the left panel, now showing the maximum virial mass of the satellites instead of the stellar mass at infall.
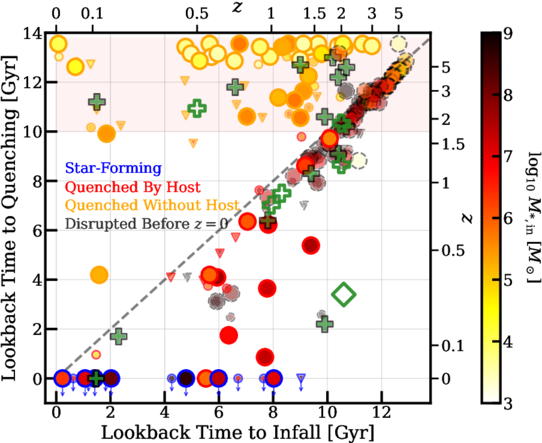
Figure 4. Lookback time to infall and quenching for all simulated satellites, colored by their stellar mass at infall. The top shaded region highlights the rough time of reionization. The outlines of the simulated points follow the convention from Figure 1, with disrupted satellites in fainter dashed gray outlines, and surviving star-forming, quenched by host, and quenched >1 Gyr prior to infall satellites are indicated in solid blue, red, and orange outlines, respectively. Both Mint (large circles) and Near Mint (smaller circles and triangles) are included for comparison with the observed patterns in infall and quenching time for Milky Way satellites. Observed satellites, shown as filled green pluses, are from S. P. Fillingham et al. (2019) and disrupted galaxies are from R. P. Naidu et al. (2022). Star-forming satellites are indicated at the bottom of the figure with a lookback tQ = 0 and blue arrows as a lower bound for tQ. The gray dashed line indicates the 1:1 line.
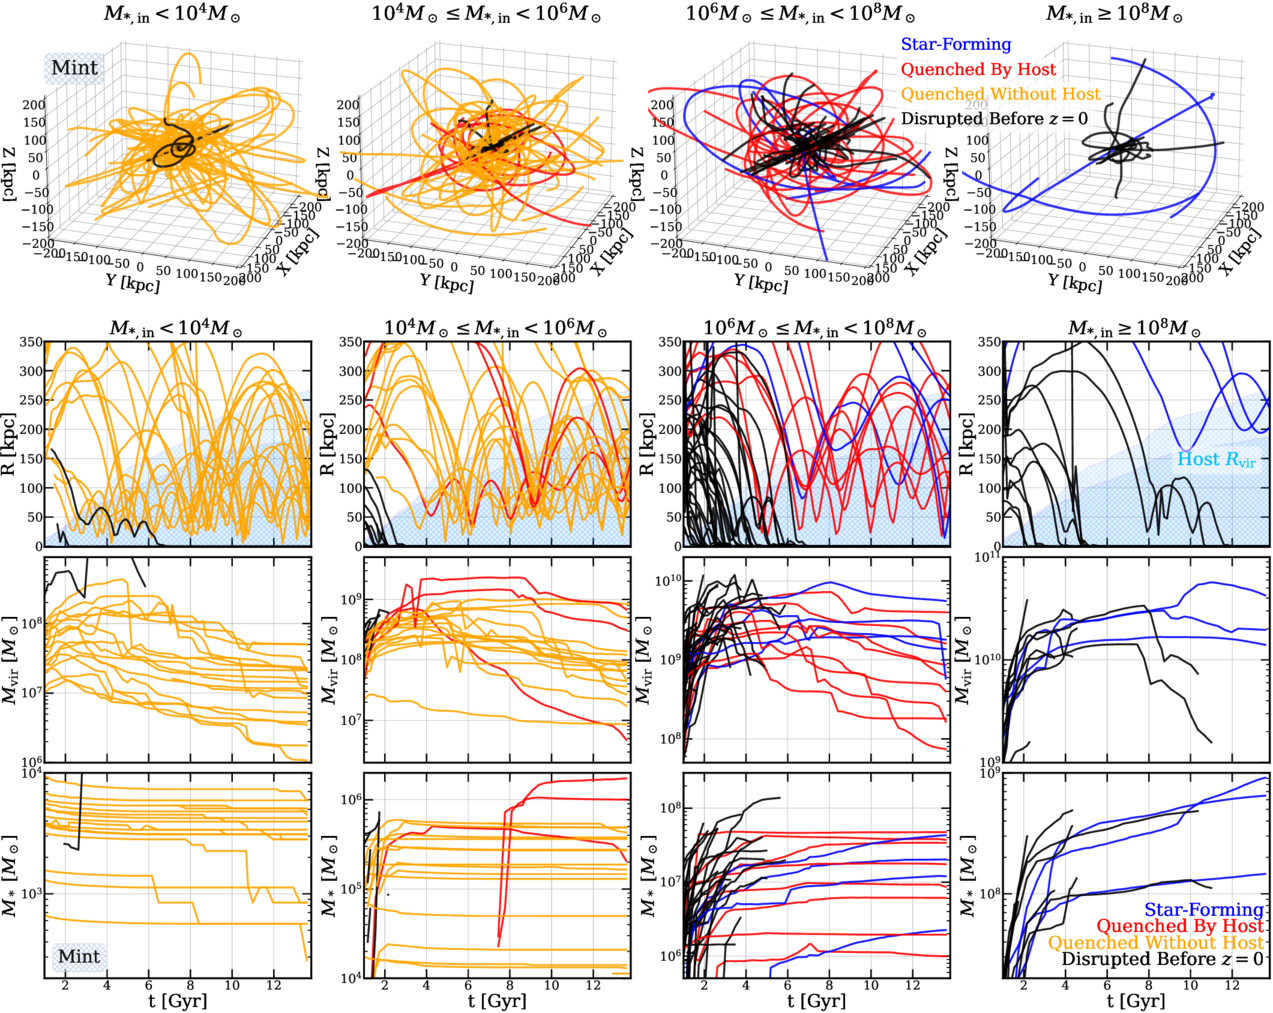
Figure 5. Top row: tracking satellite orbital trajectories starting 1 Gyr prior to infall for all satellites from the Mint simulations binned by stellar mass at infall. Orbits are centered on the center of mass of the host (gray dot). Black lines show the orbits of disrupted galaxies as they sink to the center and merge with the host, and solid color lines show surviving galaxies, with line colors corresponding to the convention in Figure 1. Position data for satellites are interpolated across snapshots until disruption (merger with host) for disrupted satellites and z = 0 for surviving satellites. From left to right, each figure corresponds to a different infall stellar mass bin: ultralow (M* < 104 M⊙), low (104 M⊙ ≤ M* < 106 M⊙), intermediate (106 M⊙ ≤ M* < 108 M⊙), and high (M* ≥ 108 M⊙). Second row: tracking the interpolated radial distance from the central host as a function of time for all Mint resolution satellites up until disruption or z = 0. The evolution of the virial radii of the two Mint hosts are indicated in cyan. Third row: the virial mass of each Mint satellite up until disruption or z = 0. Bottom row: the stellar mass of each Mint satellite as a function of time.
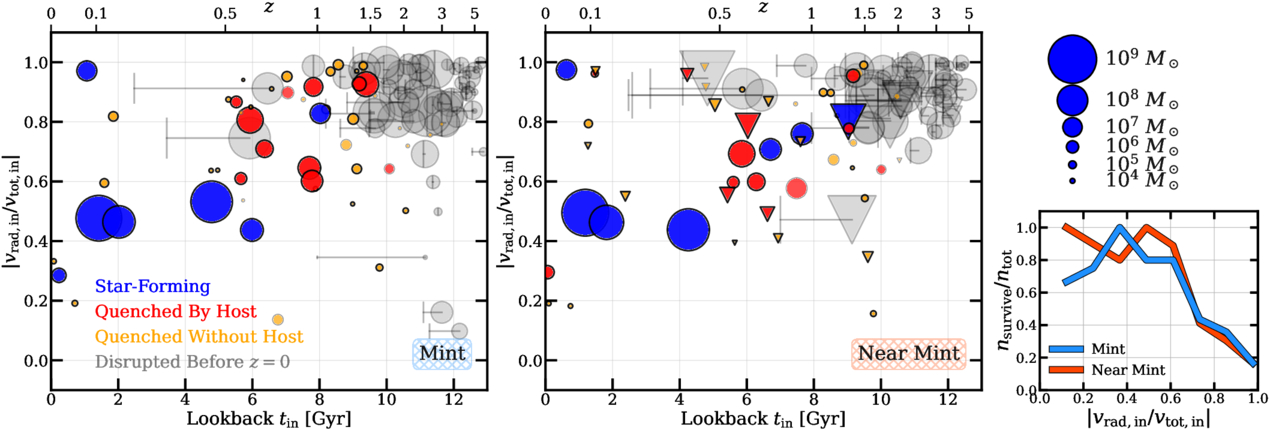
Figure 6. Left: the fraction of total velocity in the radial direction at infall, vrad,in/vtot,in, for satellites as a function of their lookback time to infall, for Mint satellites. Point color and styles are as in Figure 3. The size of each point scales logarithmically with the stellar mass of the satellite at infall as shown to the right, with more massive satellites in larger markers. Horizontal lines out to the time of disruption are included for disrupted satellites. Center: similar to the left panel, for Near Mint satellites, where circles are used for satellites of Sandra and Elena, and triangles for Ruth and Sonia. Right: the fraction of total Mint (light blue) and Near Mint (orange) satellites that survive, binned as a function of vrad,in/vtot,in.
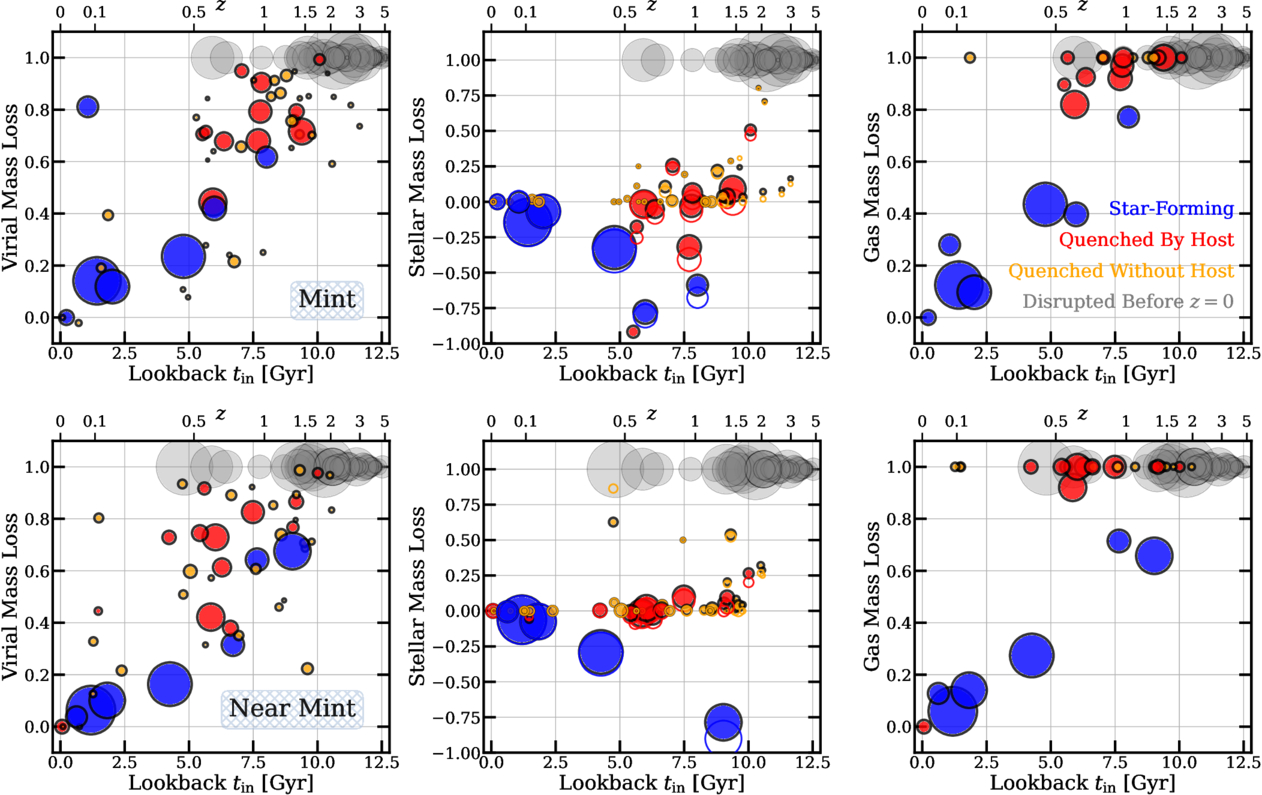
Figure 7. Top left: fraction of virial mass lost since infall as a function of lookback time to infall for Mint satellites. Marker colors and sizes are as in Figure 6, where disrupted satellites have mass-loss fractions of one. Top middle: fraction of stellar mass lost since infall as a function of lookback time to infall for Mint satellites. Fractions of star particles lost since infall (which includes mass loss due to stellar evolution) are indicated in the corresponding open circles. Negative values indicate a growth in stellar mass since infall. Top right: fraction of gas mass lost since infall as a function of lookback time to infall for Mint satellites. Many satellites infell with no gas, and are hence excluded from this panel. Bottom row: similar to the panels in the top row, but for all Near Mint satellites for comparison.